


Bitcoin Tumbles Below $20K but is Another Drop Imminent? (BTC Price Analysis)

Bitcoin’s bearish stage seems far from over as the second rebound from the $18K support level turned out into another bull trap. The price is currently attempting to break a critical support level.
Technical Analysis
By Shayan
The Daily Chart
The cryptocurrency recovered from the $18K level earlier in September after failing to surpass the $24K mark. Yet, the 50-day and 100-day moving averages, seen at roughly $22K, rejected the price to the downside. Bitcoin has also failed to break above the significant bearish trendline, where it has been held below since the current bear market started.
Although the $18K level remains intact, the market structure remains bearish until the price successfully breaks above the mentioned descending trendline and reaches the $24K resistance.
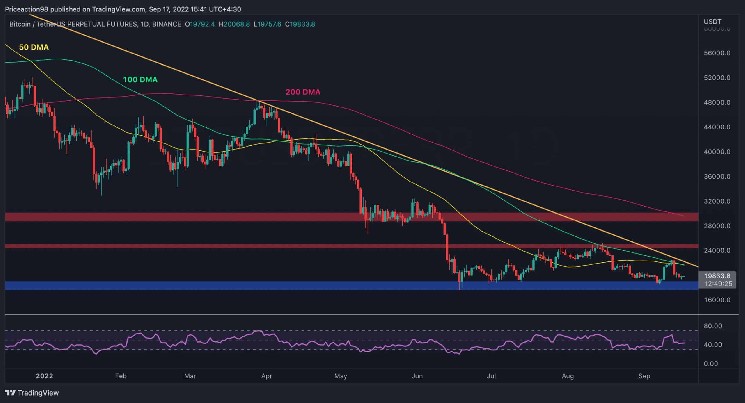
Furthermore, a breakdown of the $18K level could initiate a bloodbath as the market could crash to $15K and even deeper in the short term.
The 4-Hour Chart
On the 4-hour chart, it is clear that after the price broke above the $20K level following the strong rebound off the $18K support, it was rejected from $22.5K and has quickly returned to the $19K region, which is currently serving as major support.
The Fibonacci retracement tool also places the price in an important area between 0.618 and 0.5, called the Fibonacci golden zone. Hence, if the level holds, another rally towards the $22,500 level and eventually the $24K level would be conceivable.
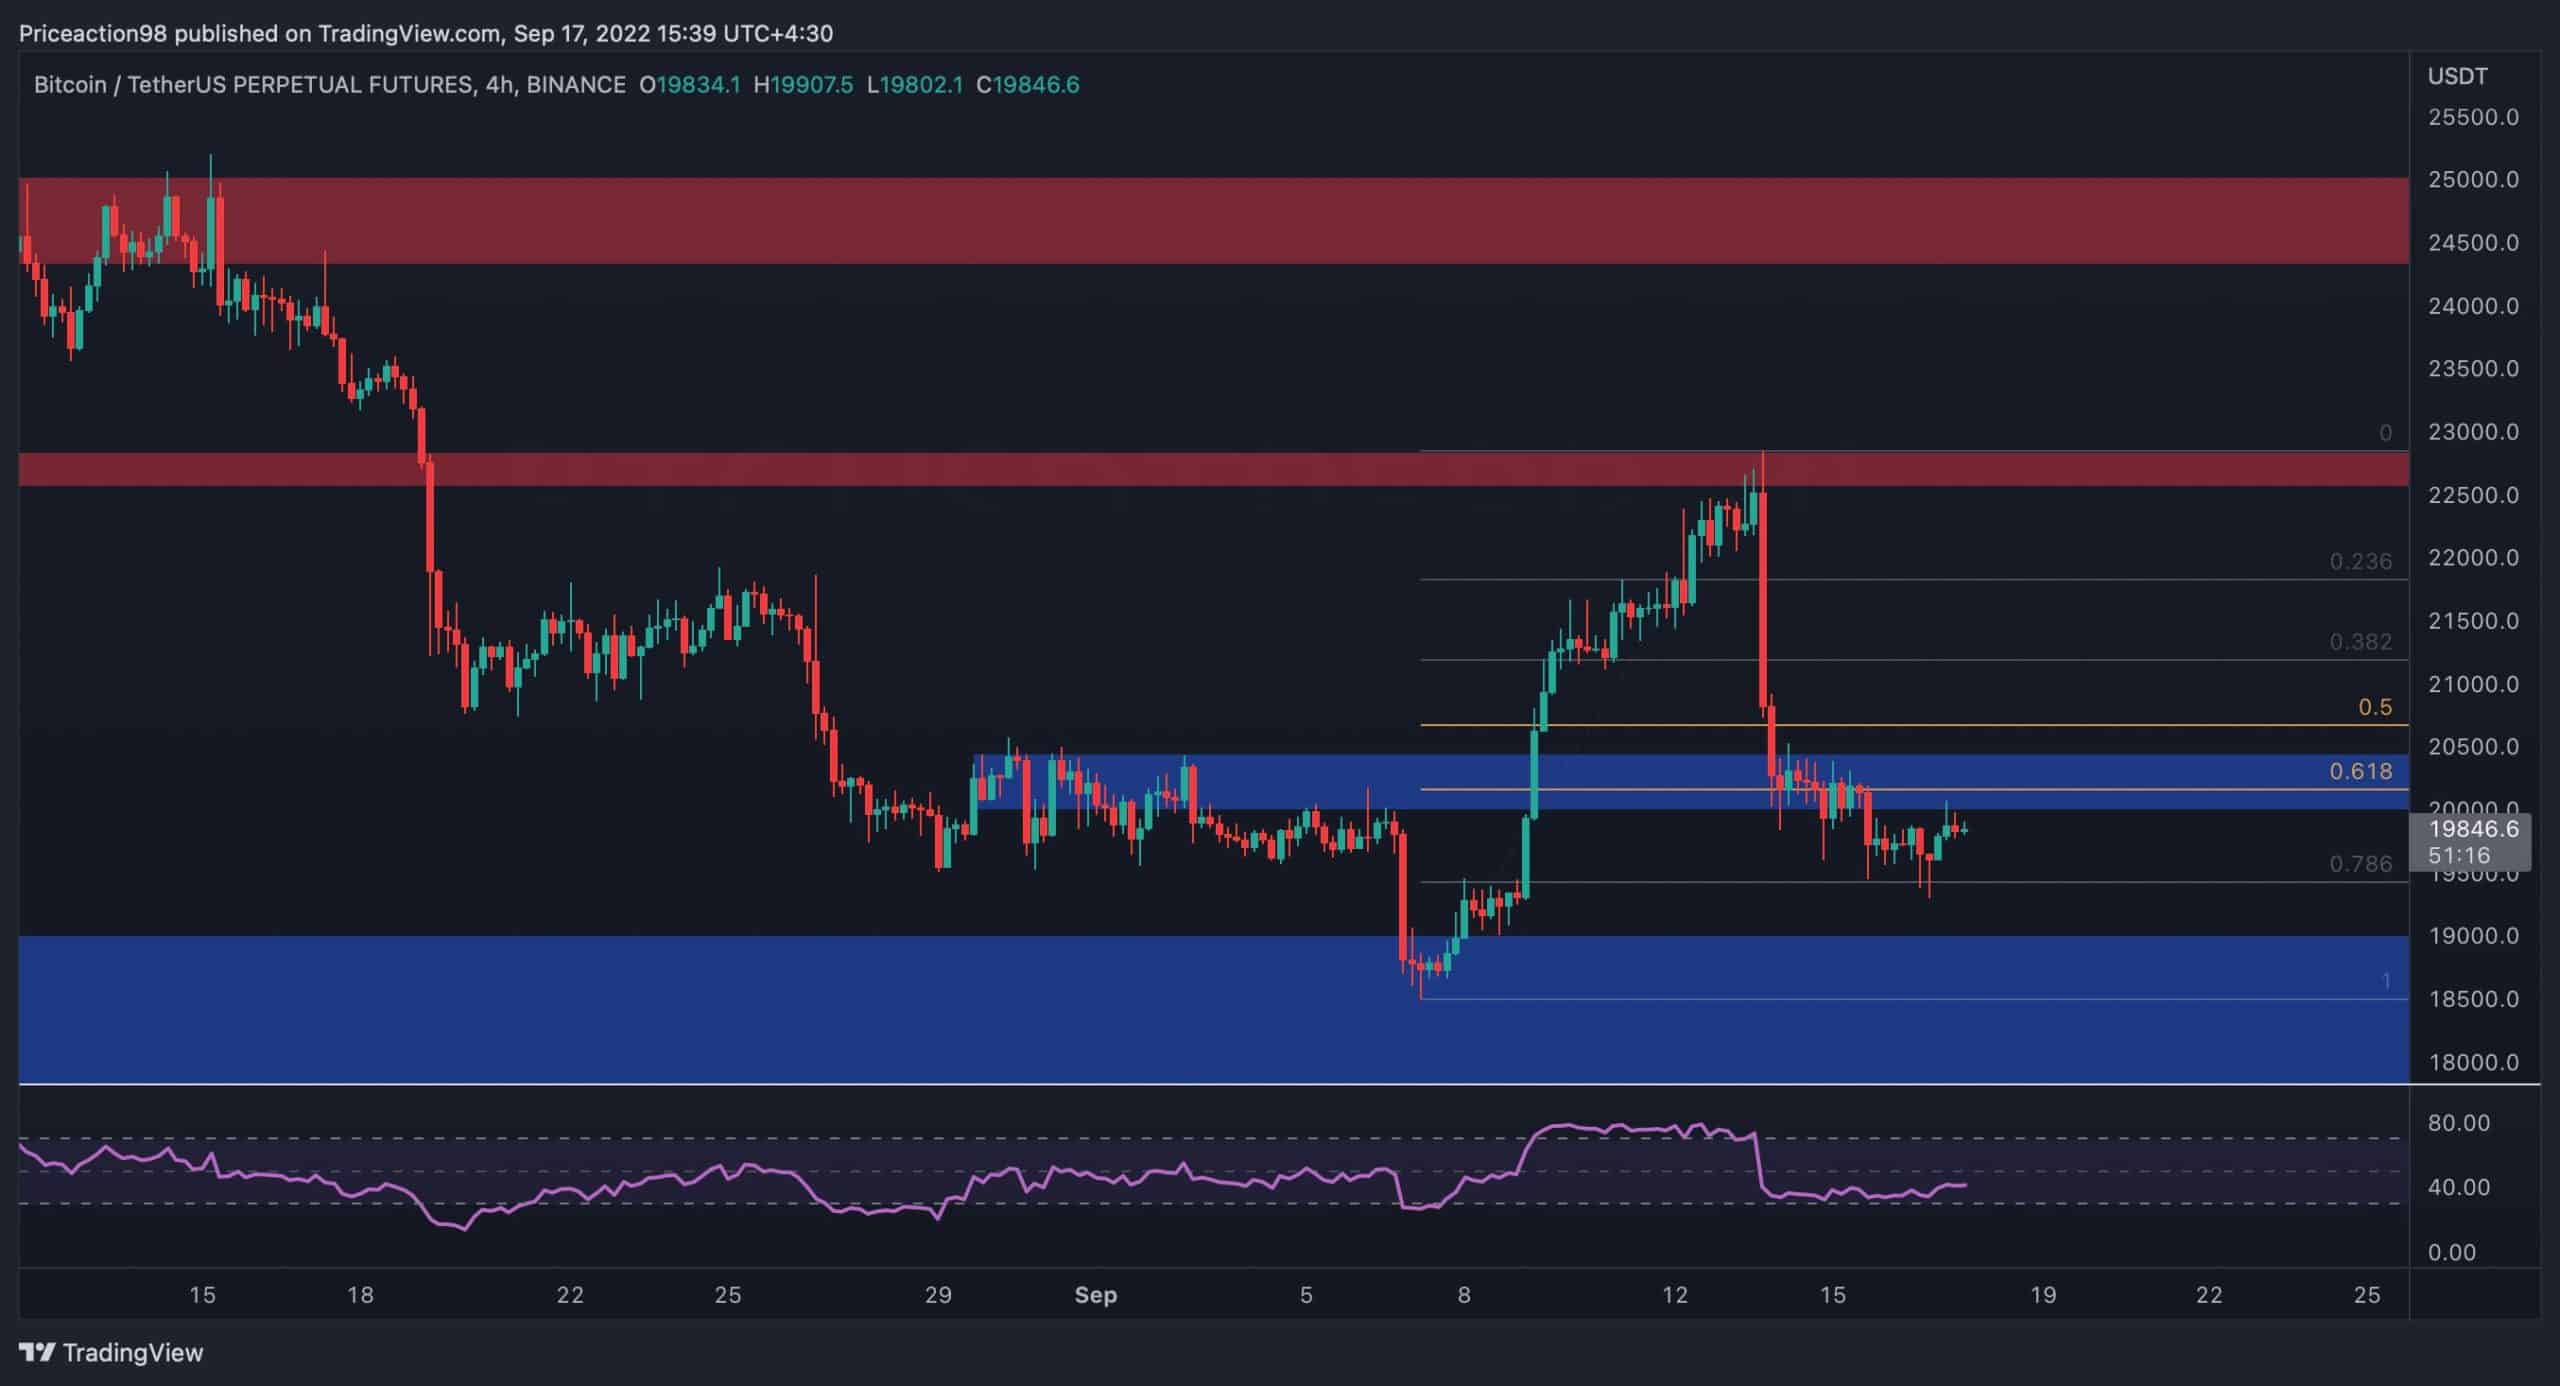
However, according to the RSI indicator, the more likely scenario is still a breakdown and bearish continuation in the short-term, as the momentum is in favor of the bears.
Onchain Analysis
By Shayan
Exchange Whale Ratio Metric
The whales are an important cohort among market participants. Hence, tracking their behavior might help in anticipating the trend. The Exchange Whale Ratio metric can be used to identify their activity by comparing the ratio of deposits by whales to the whole amount of deposits in a day.
According to the chart, it is apparent that the whales managed to distribute their coins during the first stages of a bear market and accumulate at lower prices.
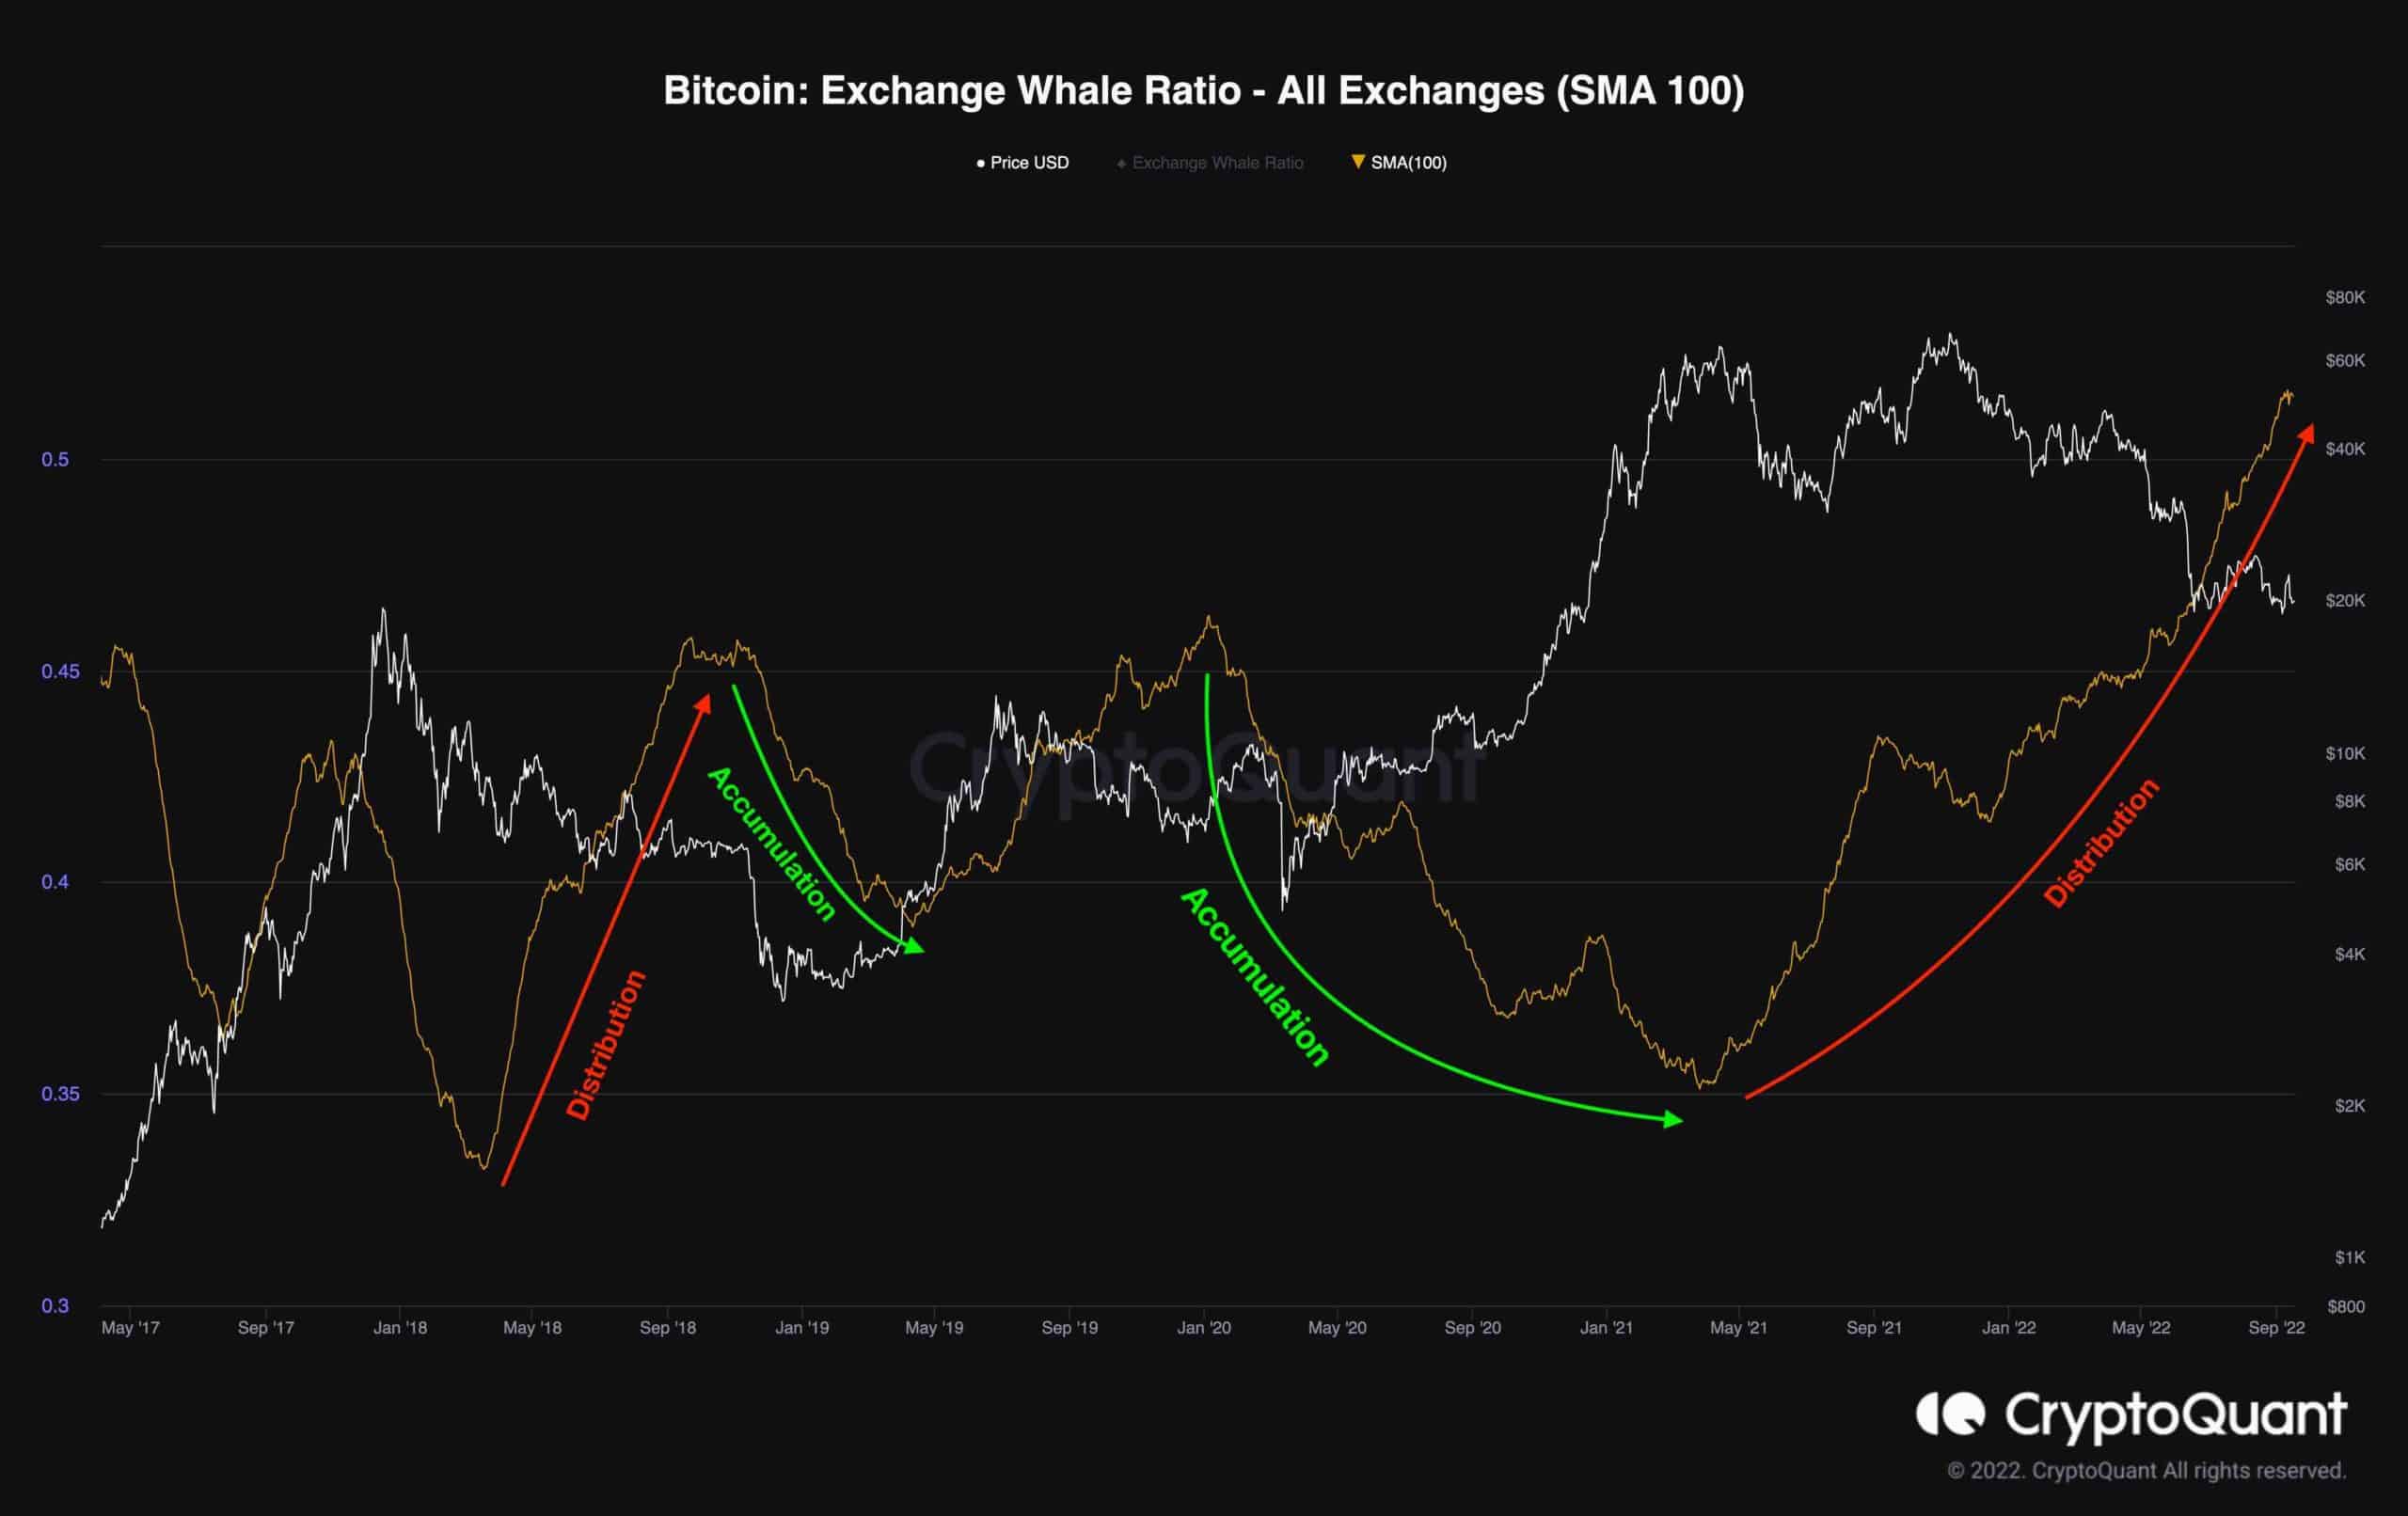
Currently, the metric is still in an upward rally, indicating distribution. Overall, the market appears far from bottoming out, and a final capitulation event might occur.


 Bitcoin
  Ethereum
  Tether
  USDC
USDC  Dogecoin
  Cardano
  Bitcoin Cash
  Polygon
  Litecoin
  LEO Token
  Hedera
  Stellar
  Cosmos Hub
  OKB
OKB  Maker
Maker  Algorand
  NEO
NEO  Gate
Gate  KuCoin
  Synthetix Network
  IOTA
IOTA  Tether Gold
  TrueUSD
  Enjin Coin
  Holo
Holo  Ravencoin
  0x Protocol
  Siacoin
  Basic Attention
  Decred
  Zcash
Zcash  Ontology
  Lisk
Lisk  Waves
Waves  DigiByte
  Numeraire
  Status
  Nano
Nano  Pax Dollar
  Steem
Steem  OMG Network
  BUSD
BUSD  Ren
Ren  Bytom
Bytom  Bitcoin Diamond
  HUSD
HUSD  Energi
  Augur
Augur