Bitcoin Weekly Forecast: Macro bearish trend persists, but a respite for BTC bulls

- Bitcoin price remains at a critical level from a macro perspective and could still crash another 40%.
- BTC is primed for a quick recovery rally to $21,874 from a short-term outlook and could give bulls a much-needed break.
- Transaction history suggests a steep nosedive for the big crypto if these levels are breached.
Bitcoin price has not only swept key swing lows, as noted in last week’s articles, but it has also reached its first recovery level target. While the recovery rally was as quick as it was a surprise, investors can hope for a minor retracement to get on the next leg-up.
Although the short-term outlook might look bullish depending on the time frame, the larger picture for BTC remains massively bearish with the possibility of another catastrophic crash brewing.
Bitcoin price and the macro outlook
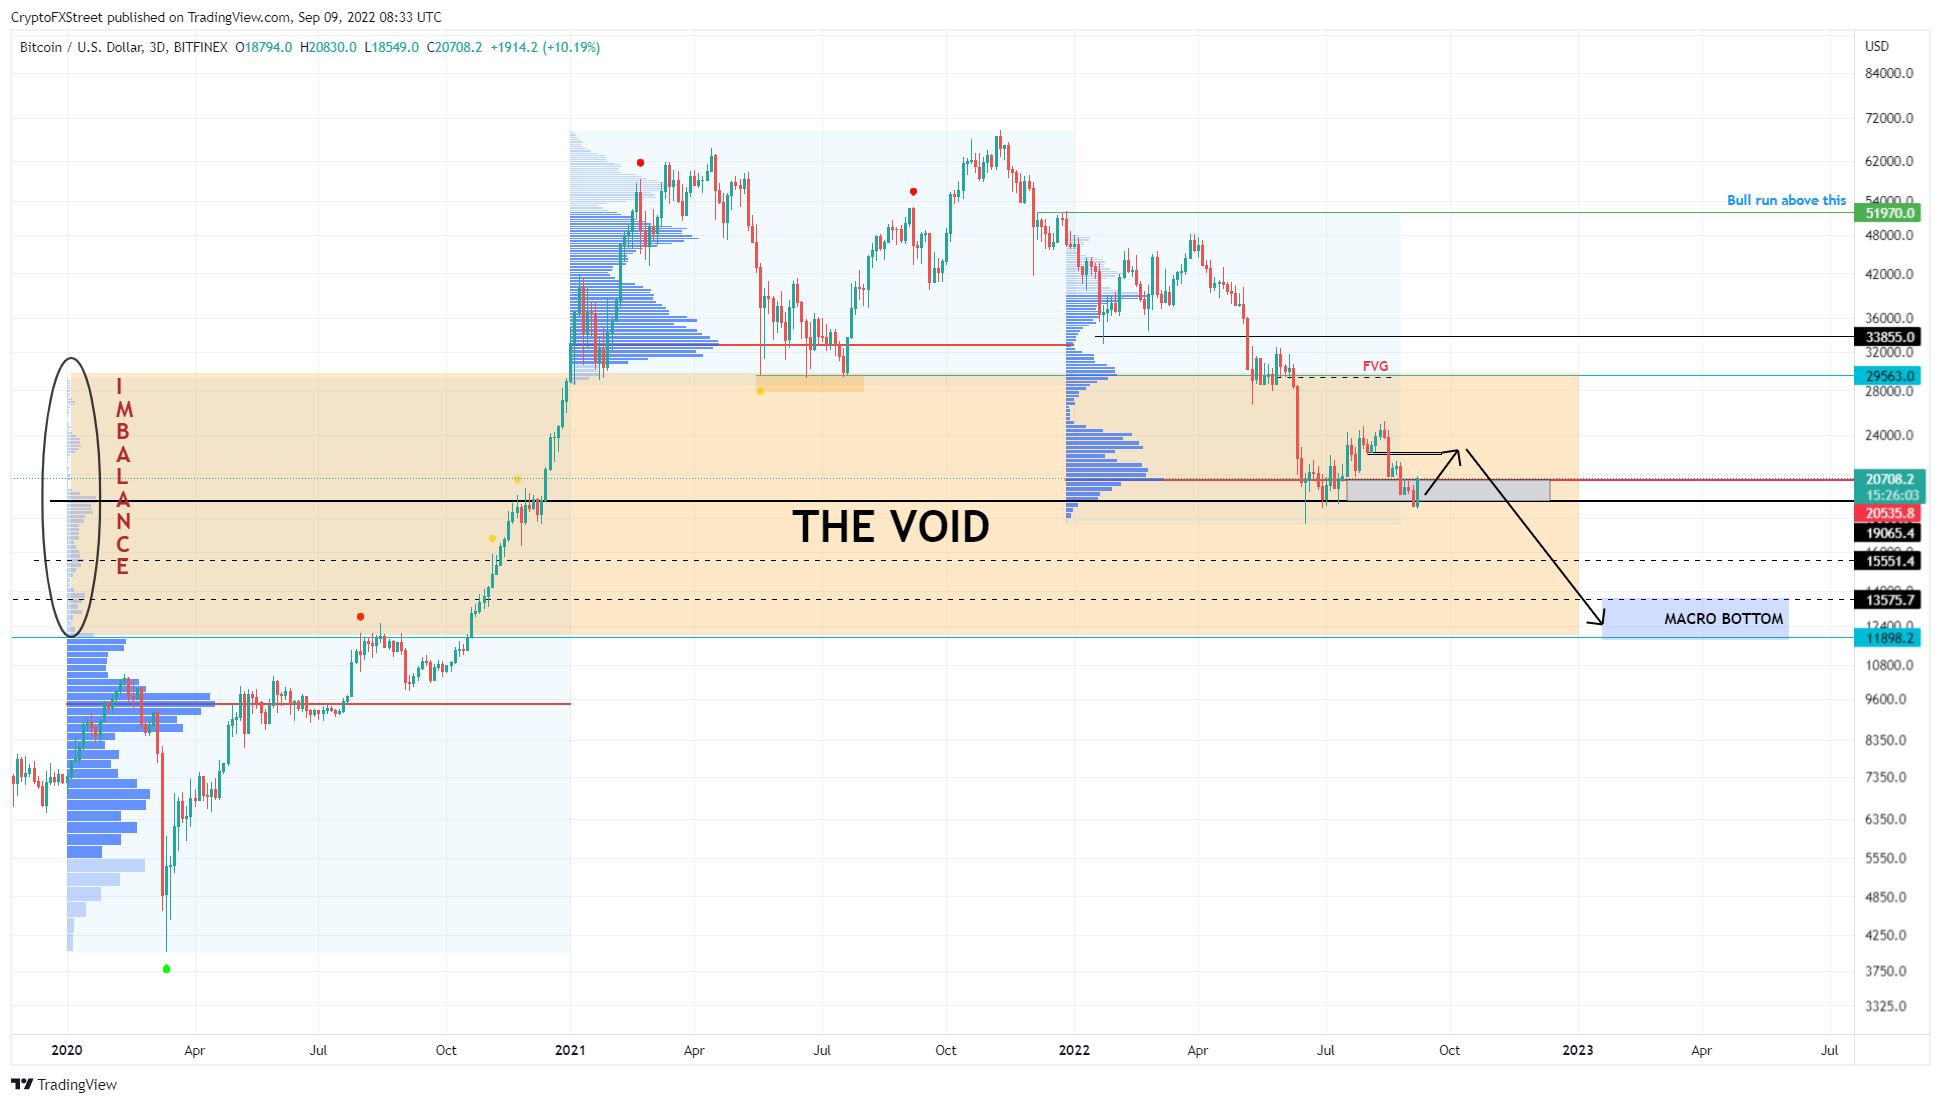
Bitcoin price, as described in the previous weekly update, continues to fill up the void, extending from $29,563 to $11,989. Very little volume was traded in this area as BTC rallied 145% between October 18, 2020, and December 29, 2020, creating an inefficiency.
Hence, the recent dive in Bitcoin price is a corrective move to fill up the imbalance.
As Bitcoin price tags the $19,087 to $20,562 support area, there is a remarkable yet obvious bullish reaction since this area coincides with the 2022 Point of Control (POC), or the highest traded volume level, at $20,562 .
Investors can expect this bounce to extend a little higher as market participants vie for a recovery rally. However, the larger outlook is bearish, and a breakdown of the $19,087 level will trigger the next leg down.
This nosedive could potentially shed 42% of Bitcoin price’s current value and push it down to $11,989 or the $12,000 psychological level, which could very well be the macro bottom for the big crypto and the entire market.
Readers should note that this massive downswing is NOT likely to happen over the next two or three weeks but could occur in December 2022 or the first quarter of 2023.

BTC/USDT 1-day chart
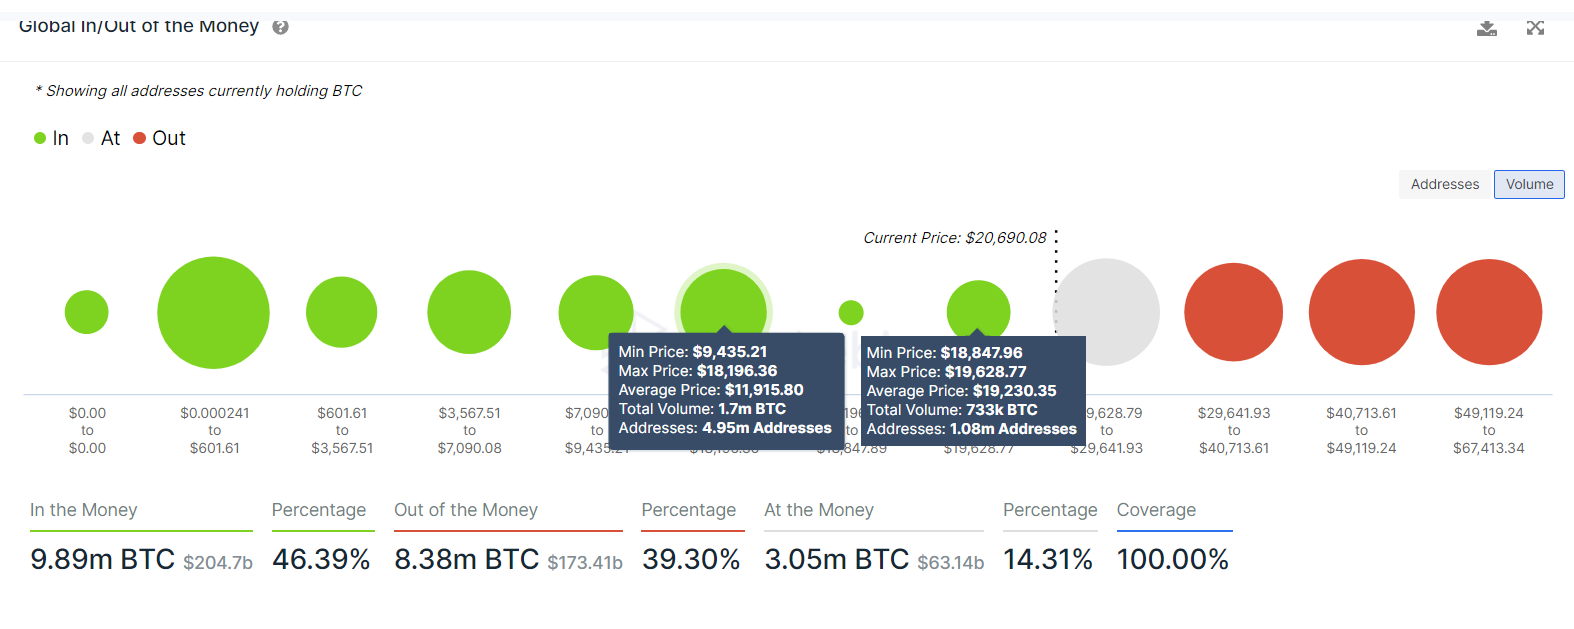
Supporting this downtrend and the critical support areas described above for Bitcoin price is IntoTheBlock’s Global In/Out of the Money (GIOM) model. This on-chain index shows that the immediate support level at $19,230 is weak, and a breakdown could knock BTC down to the next support cluster that extends from $9,435 to $18,196. Here the roughly 4.95 million addresses that purchased 1.7 million BTC at an average price of $11,915 are “Out of the Money.”
Interestingly, this level coincides perfectly with the one forecasted from a technical outlook and adds credence to the macro bottom occurring anywhere between $11,989 to $13,500.

BTC GIOM
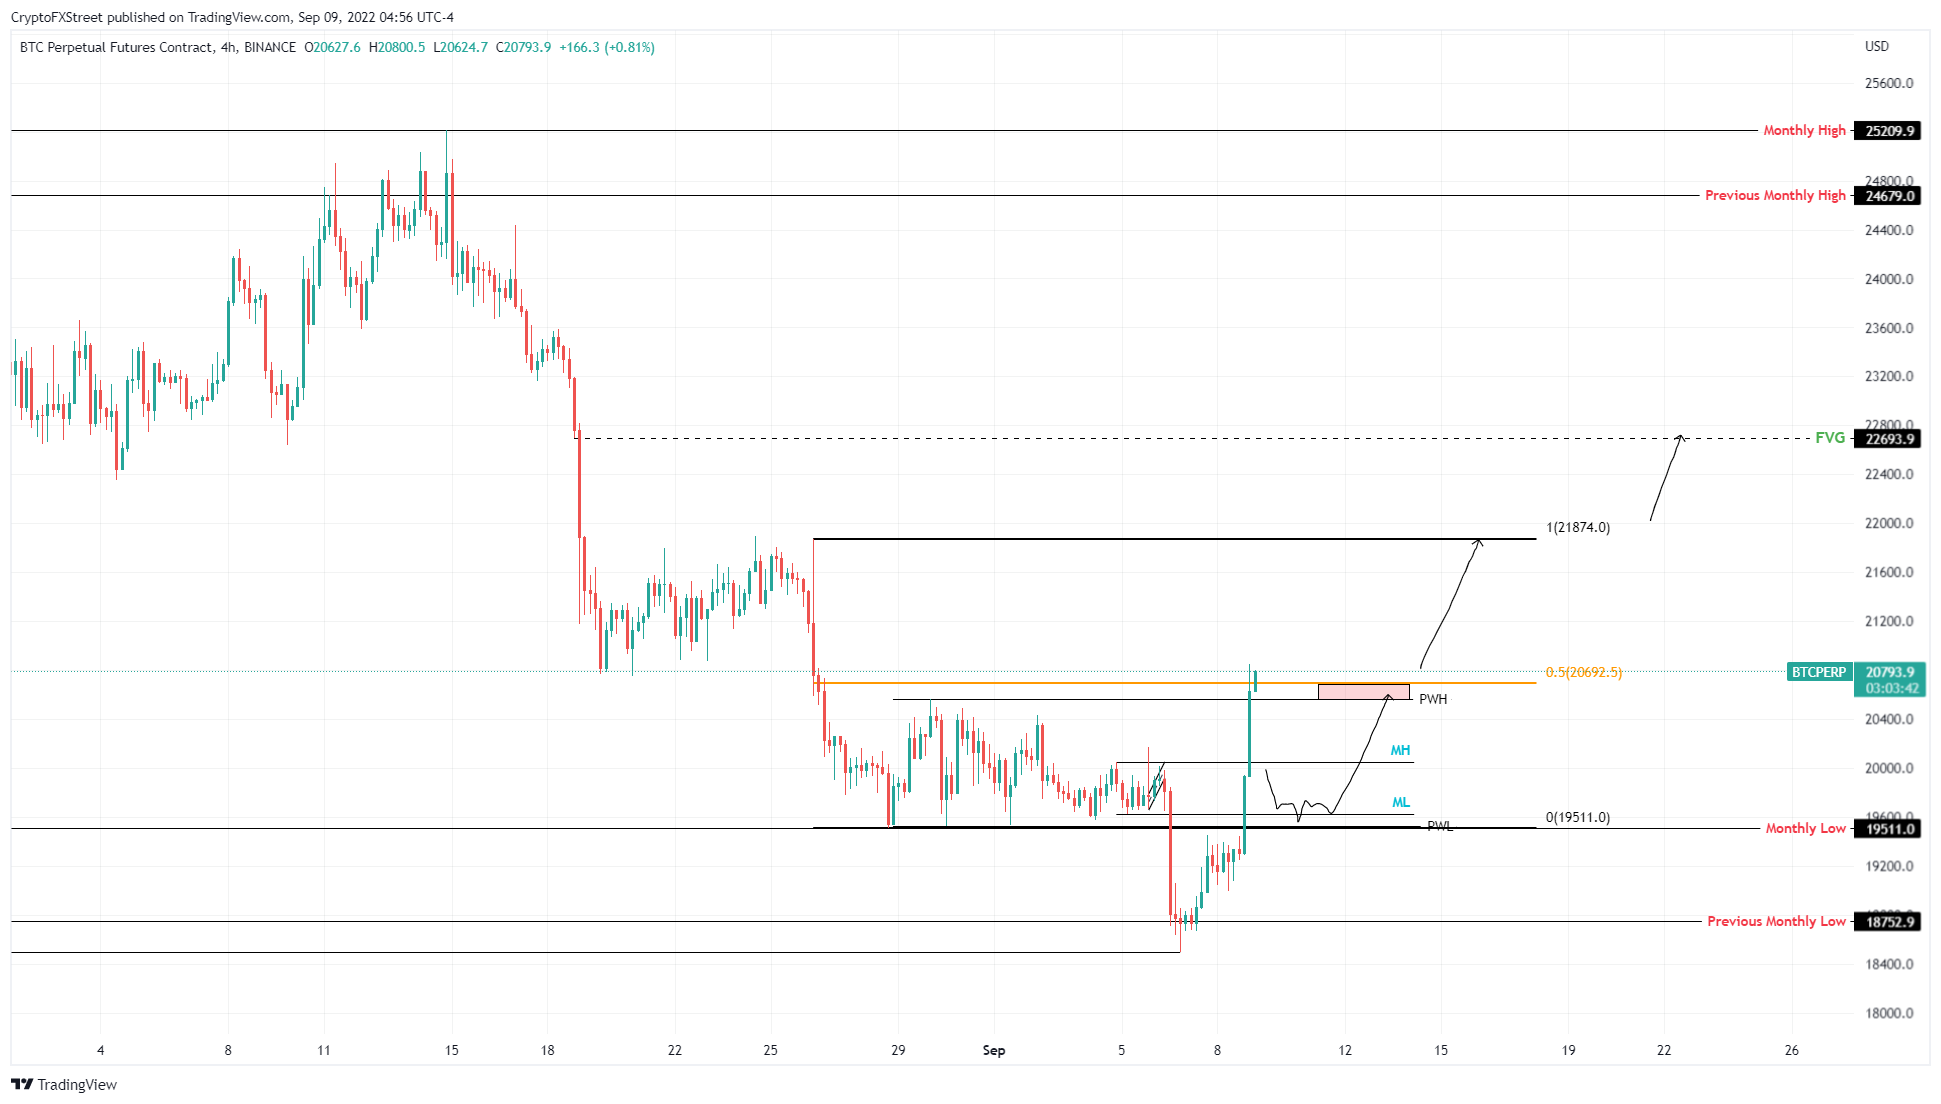
On a lower time frame, Bitcoin price looks likely to pull back to $20,000 or $19,511 before making the next move. The rationale for this retracement is to refuel the bullish momentum before the next leg-up to equal highs at $21,874.
A sweep of this level is likely to form a local top here, but Bitcoin price might revisit the $22,693 hurdle in a highly optimistic case.

BTC/USDT 4-hour chart
While Bitcoin price remains in an overall downtrend, a daily and a weekly candlestick close above $25,000 will invalidate the bearish outlook and suggest a premature reversal of the downtrend.
In such a case, investors should wait for secondary confirmation like higher lows and higher highs before jumping on the bull run bandwagon that could potentially revisit the $30,0000 psychological level.


 Bitcoin
  Ethereum
  Tether
  USDC
USDC  TRON
TRON  Dogecoin
  Cardano
  Bitcoin Cash
  Monero
  Chainlink
  LEO Token
  Stellar
  Zcash
Zcash  Litecoin
  Hedera
  Dai
Dai  Cronos
  Tether Gold
  OKB
OKB  Ethereum Classic
  KuCoin
  Gate
Gate  Cosmos Hub
  Algorand
  Dash
Dash  VeChain
  Tezos
Tezos  Stacks
  TrueUSD
  Decred
  IOTA
IOTA  Theta Network
  Basic Attention
  NEO
NEO  Synthetix
  Qtum
Qtum  DigiByte
  0x Protocol
  Ravencoin
  Zilliqa
  Nano
Nano  Siacoin
  Holo
Holo  Numeraire
  Waves
Waves  Enjin Coin
  Ontology
  Status
  BUSD
BUSD  Hive
Hive  Pax Dollar
  Lisk
Lisk  Steem
Steem  Huobi
Huobi  OMG Network
  Bitcoin Gold
  NEM
NEM  Augur
Augur