


BTC Analysis: Bitcoin Continues 20-Day Range After Closing Monthly Candle Beneath Previous ATH — Where Next?

Key takeaways:
- Bitcoin is down by a sharp 25% from the August highs of $25,200
- BTC/USD closed the September monthly candle beneath the previous all-time high price
- Despite the bearish sentiment, there is a slight uptick in the number of new addresses
| BTC Price | $19,255* |
| Key Support Levels | $19,000, $18,585, $18,400, $18,000, $17,830, $17,160, $16,615, $16,000, $15,700, $15,315 |
| Key Resistance Levels | $19,575, $19,720, $20,000, $20,500, $20,700, $21,000, $21,600, $22,650 |
*Price at the time of publication
Bitcoin is now down by a total of almost 25% from the August highs of $25,200 as the cryptocurrency continues to battle in a tight range between the low at $18,160 and the September high at $22,800. In fact, the upper angle of the range has been much tighter over the previous nineteen days as BTC failed to post a daily closing candle above the $20,000 resistance.
The bearish sentiment is largely a result of the overarching narrative regarding inflation, with the US Federal Reserve continuing to hike interest rates in September by another 75 BPS, bringing the current US Fed Funds Rate to 3.25%.
This narrative has consistently plagued the market with bearish pressure as investors continue to wait on the sidelines for further clarification on how high-interest rates might go. Most traders continue to keep their eyes on the Consumer Price Index, hoping to see a reduction to indicate that inflation is starting to fall, with the next CPI announcement scheduled for October 13th.
The inflation narrative is sending shockwaves throughout the financial sector, with major indices such as the SP500 and the NASDAQ losing crucial ground last week and creating fresh new lows for 2022.
Although BTC/USD is still yet to create a fresh new low for 2022, the monthly candle for September closed beneath the previous all-time high price seen toward the end of 2017, creating doubts that the weekly 200-SMA at $18,000 will hold moving forward. This was noted by prominent analyst Cyber David Trading, who has over 60,000 members in his group. David is now targeting $14,000 if the $18,000 support fails to hold.
If BTC continues to plummet, traders will continue to look at the weekly 200-SMA for support. The weekly 200-SMA supported the market during the May price collapse, and traders are now looking back to the level for support moving forward. It currently sits at $18,000.

Image source: TradingView
Despite the overall bearish sentiment, there are few analysts that are starting to release some potentially positive outlooks. For example, InvestAnswers recently reminded his 440,000 YouTube subscribers that October is historically a bullish month for BTC. The average monthly return is 28.42%, pushing BTC up between $25,000 and $26,000 if the same returns were to play out. According to previous returns, October is the third-best bullish month and is commonly referred to as “Uptober”.
Lastly, one more interesting metric to keep an eye on is the fact that the number of new addresses is up from mid-July, which shows that there might be some retail interest within the market.
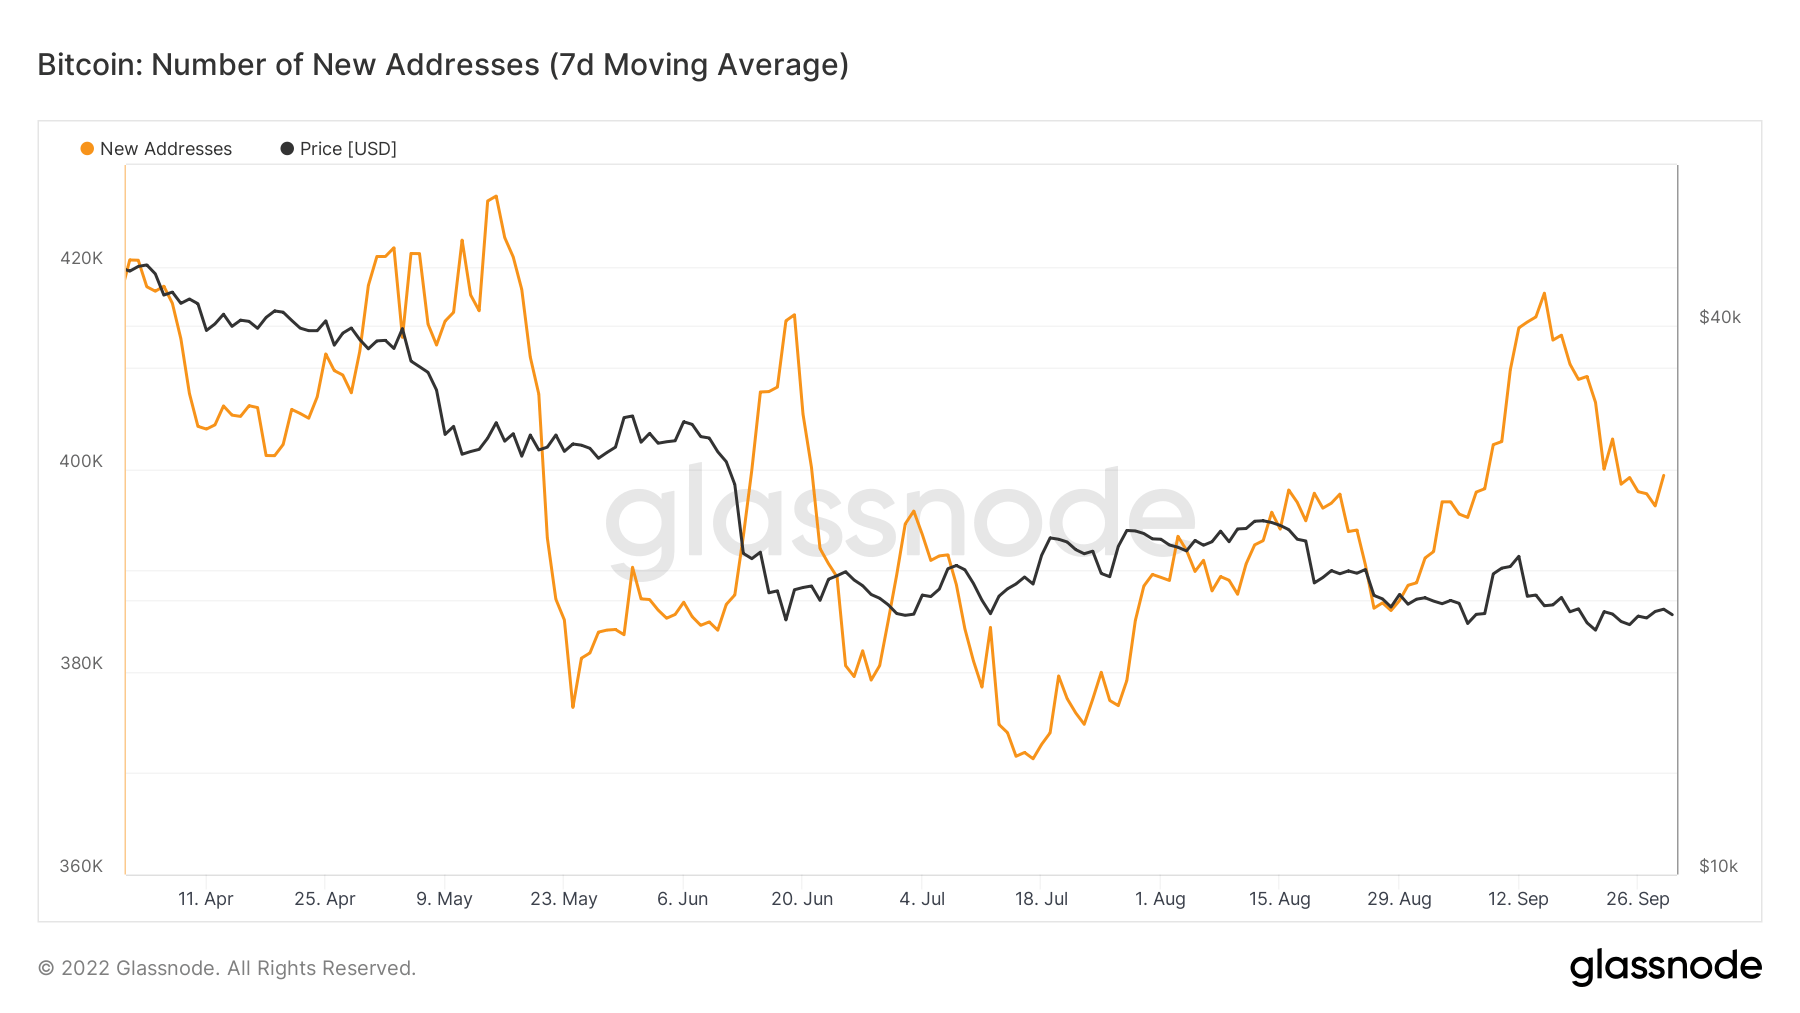
Image source: Glassnode
Nevertheless, if the CPI reading for October comes out pretty high, it could send more bearish pressure throughout the market and potentially send the market beneath $18,000.
With that in mind, let us take a closer look at the charts and see the potential support and resistance areas moving forward.
Bitcoin Price Analysis
BTC/USD — DAILY CHART — MEDIUM TERM
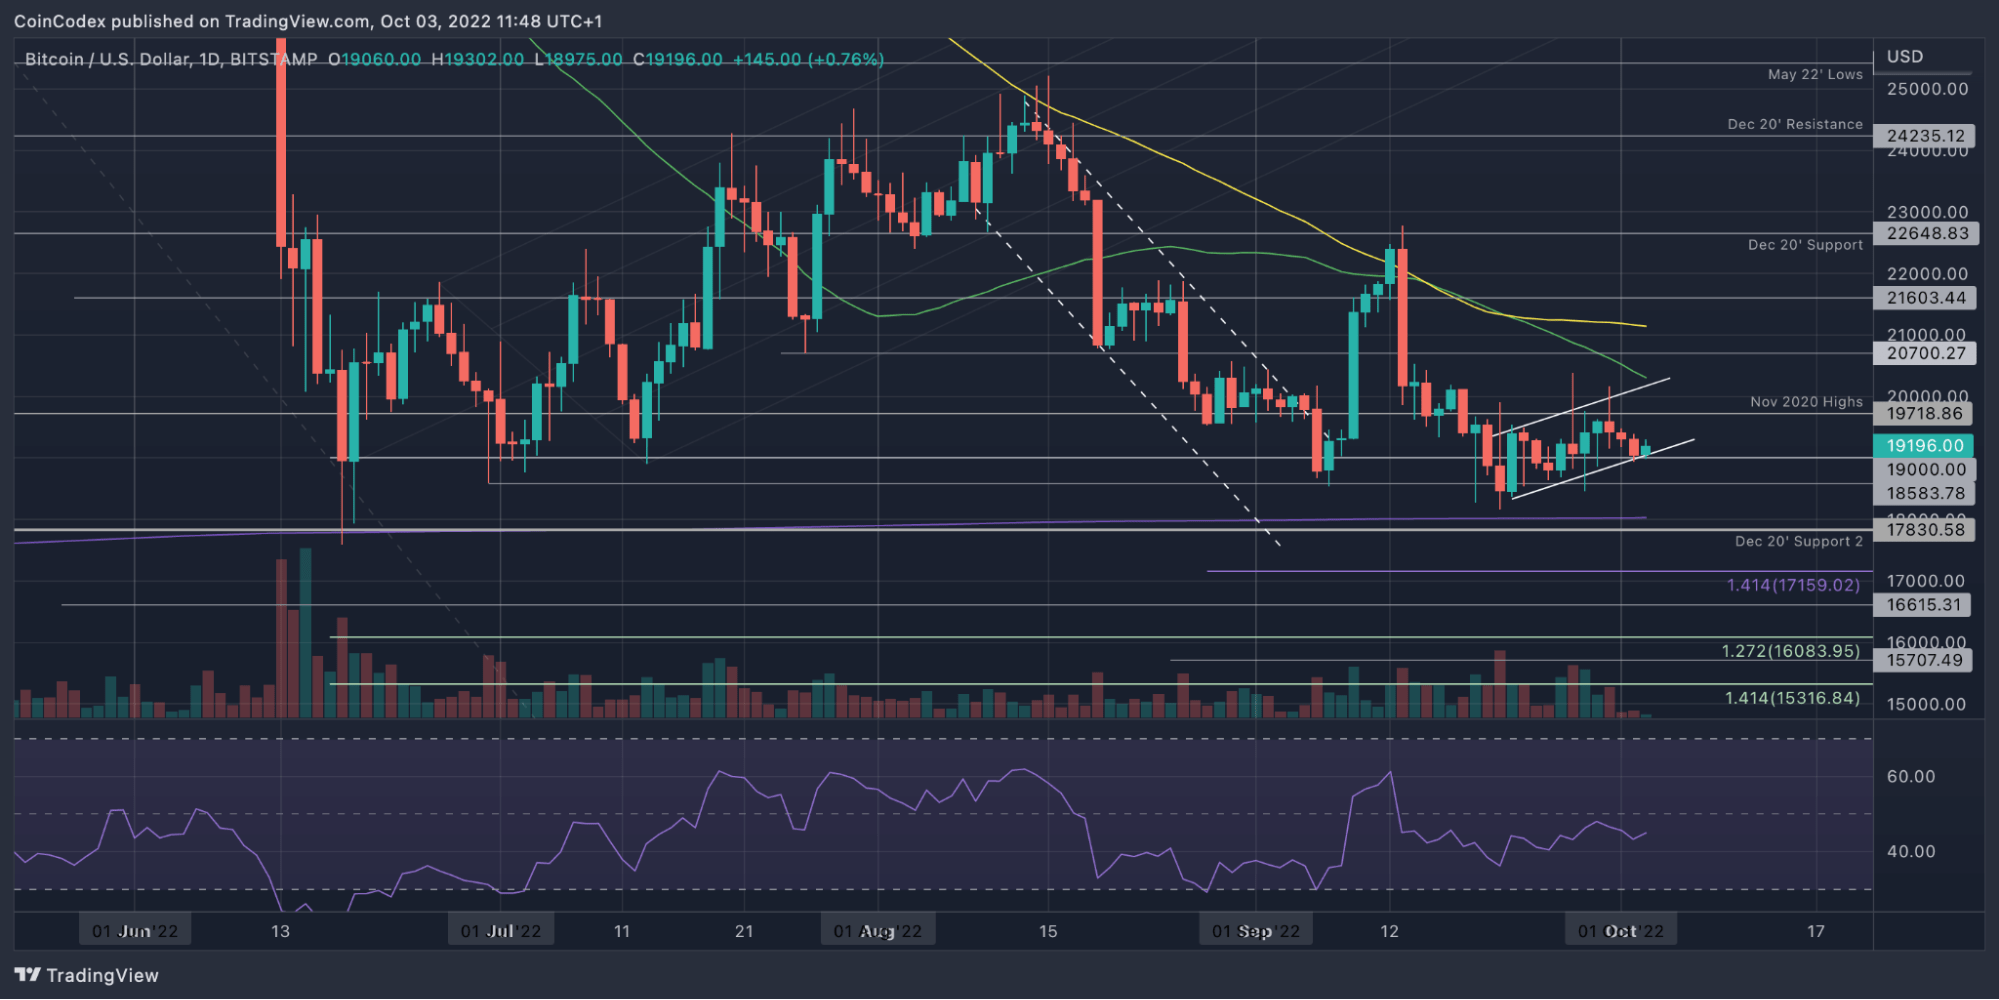
Image source: TradingView
BTC/USD — 4HR CHART — MEDIUM TERM
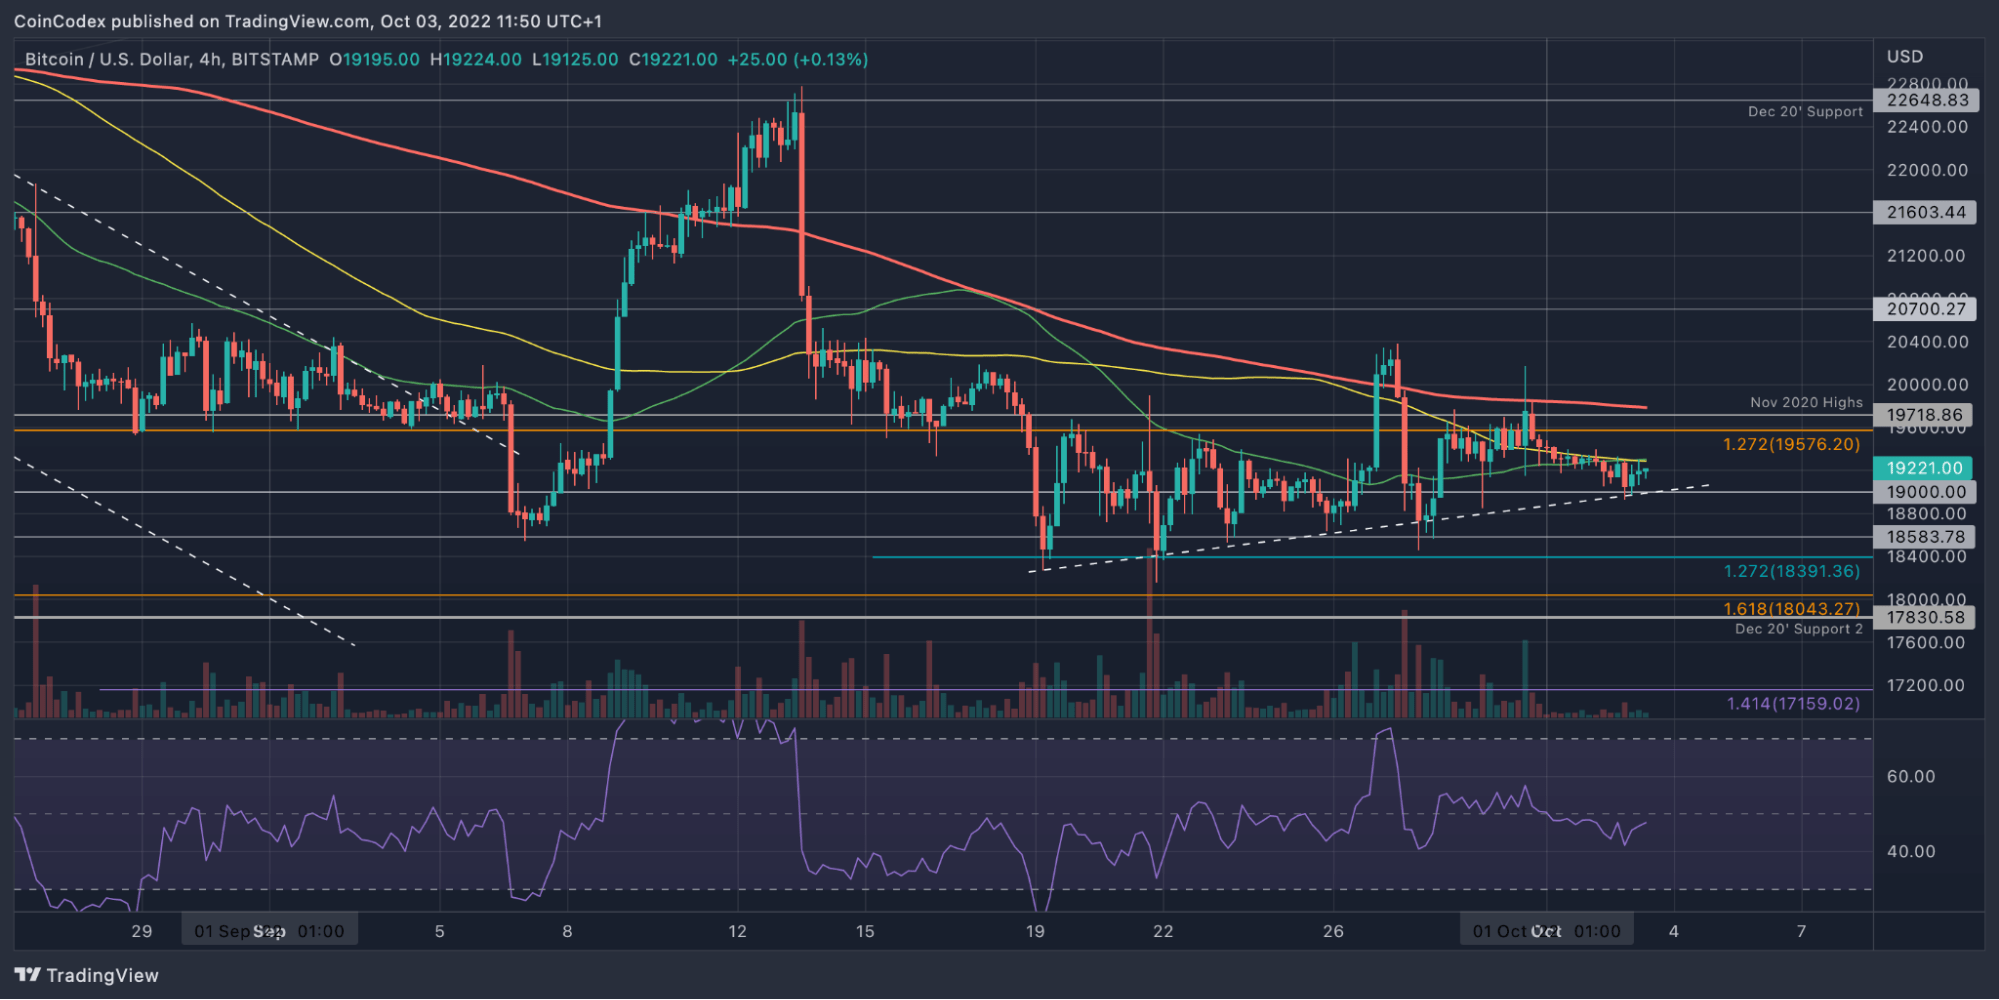
Image source: TradingView
What has been going on?
The daily chart above shows that BTC is trading inside somewhat of a bearish flag and is battling the lower boundary of the channel. A break beneath this flag will likely send BTC plummeting to the next major level of support, located at the weekly-200 SMA level at $18,000.
The market did witness a brief bullish push higher at the beginning of September, allowing BTC to reach as high as $22,650 during the move. However, BTC fell from there and has been trapped within a range between $20,000 and the September low of $18,160 for the past 20-days or so.
BTC will need to break out from this range to dictate the next direction for the market. Despite the range-bound trading, it could be seen as slightly optimistic as it hasn’t created a fresh 2022 low like the major economic indices (SP500 & Nasdaq) did last week.
Bitcoin price short-term prediction: Bearish
In the short term, Bitcoin is now considered bearish. To turn neutral, we need to see BTC rising above the $20,000 level. A break beneath the long-term support at $18,000 would send BTC in a bearish spiral down toward $15,000.
On the other side, Bitcoin would have to break above the resistance at $22,650 to kick-start another short-term bullish trend. A break above the August highs above $25,000 would confirm a bull trend that could be sustained over a longer period of time.
So, where are we heading next?
Unfortunately, there is no new information about where BTC might be heading next until the breakout of the current range. However, if BTC does manage to close a daily candle above $20,000, this could be considered a good short-term bullish signal in the eyes of some retail traders.
Nevertheless, the CPI reading is October 13th (10 days away), which could result in sideways action until then.
Looking ahead, the first level of resistance lies at $19,720 (Nov 2020 highs) — BTC has not managed to close above this level for the past 19-days. Above this, resistance lies at $20,000. If buyers can move up to break $20,000, resistance is expected at $20,700, $21,000 (100-day MA), $21,600, and $22,000.
Additional resistance is located at $22,650 (Dec 2020 support), $23,000, $24,235 (Dec 2020 resistance), and $25,000.
On the other side, the first level of support lies at $19,000 (the lower boundary of the current flag). Beneath this, support lies at $18,585, $18,000 (weekly-200 SMA), $17,830 (December 2020 support), and $17,160 (downside 1.414 Fib Extension).
Additional support lies at $16,615, $16,000, and $15,700.
According to our automatic BTC price prediction algorithm, the world’s largest crypto could drop to as low as $13,950 in the next three months. However, the long-term outlook looks far more promising, with the price of BTC reaching $37,800 in the next 12 months.


 Bitcoin
  Ethereum
  Tether
  USDC
USDC  Dogecoin
  Cardano
  Bitcoin Cash
  Polygon
  Litecoin
  LEO Token
  Hedera
  Cosmos Hub
  Stellar
  OKB
OKB  Maker
Maker  Algorand
  NEO
NEO  Gate
Gate  KuCoin
  Synthetix Network
  IOTA
IOTA  Tether Gold
  TrueUSD
  Enjin Coin
  Holo
Holo  Ravencoin
  Siacoin
  0x Protocol
  Basic Attention
  Zcash
Zcash  Decred
  Ontology
  Lisk
Lisk  Waves
Waves  DigiByte
  Nano
Nano  Status
  Numeraire
  Pax Dollar
  Steem
Steem  OMG Network
  BUSD
BUSD  Ren
Ren  Bitcoin Diamond
  Bytom
Bytom  HUSD
HUSD  Energi
  Augur
Augur