


Calm Before the Storm as BTC Looks Ready for a Huge Move (Bitcoin Price Analysis)

Bitcoin currently gives a ‘calm before the storm’ feeling, as the price has had minimal changes in the last few days. However, there are some interesting levels to watch in the short term.
Technical Analysis
By: Edris
The Daily Chart
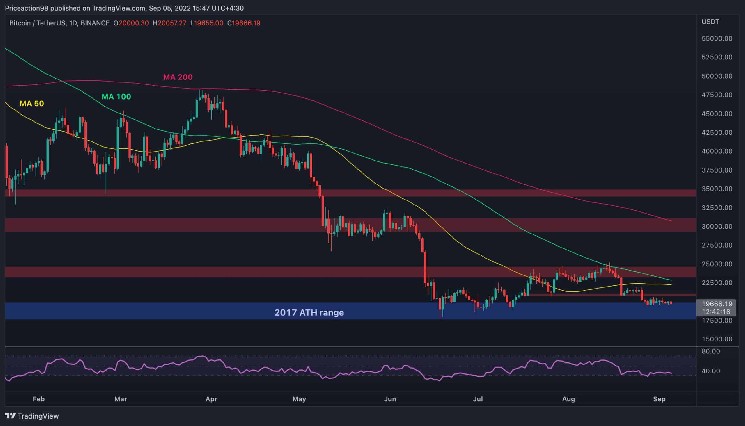
As seen on the daily chart, the price has observed very small changes in the last few days. Presently, Bitcoin is consolidating in a very tight range at the $20K support zone. The 50-day and 100-day moving average lines are located at the $22K and $23K levels, respectively.
If the price fails to break above these levels in the short-term, a bearish breakout below $20K could be expected. In this case, another massive bearish move towards the $15K area and beyond would be likely.
On the other hand, if the price breaks above these moving average lines and the $24K static resistance level, a rally towards the $30K supply zone would be highly probable. However, the market structure in the daily chart is still bearish. Ultimately, the bearish scenario appears to be the most likely outcome right now.
The 4-Hour Chart
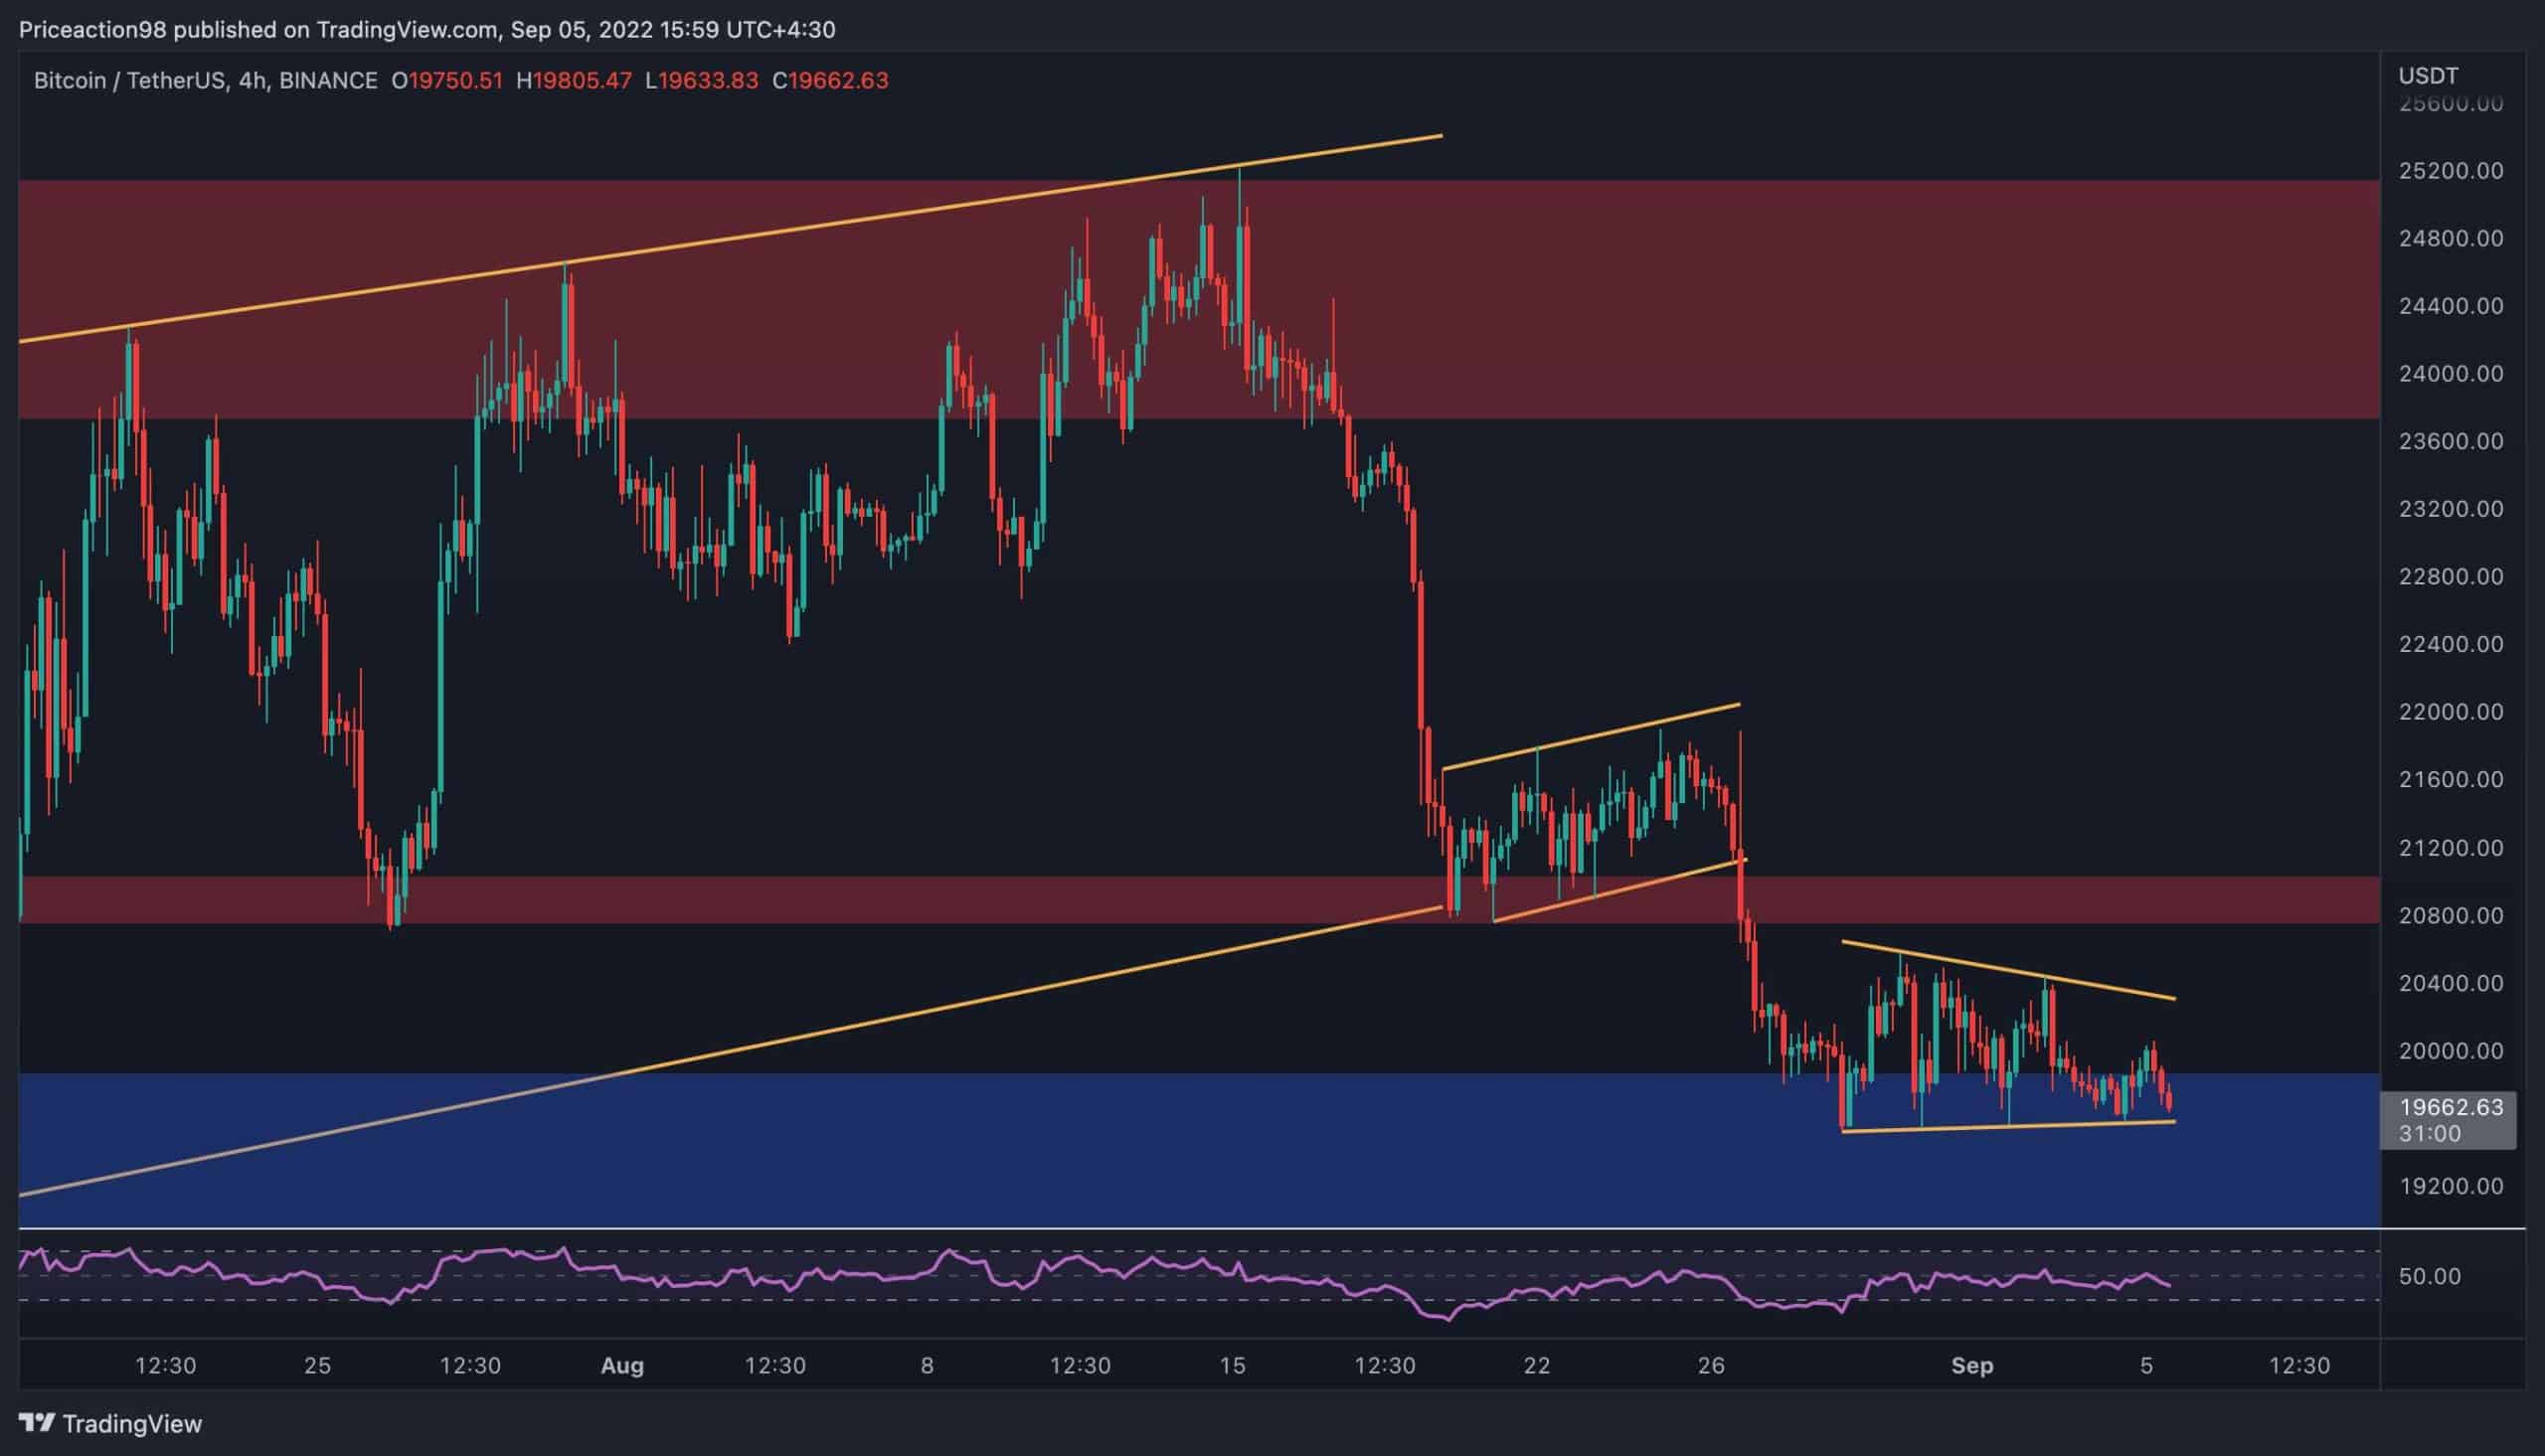
On the 4-hour timeframe, the price is trapped in a symmetrical triangle pattern between the $20K and $21K levels. These could be either continuation or reversal patterns – it depends on whether the price breaks them to the upside or the downside.
Currently, it seems as though the cryptocurrency will break below the lower boundary of the pattern after 4 rejections in the last few days. This breakout could initiate a new bearish impulsive move to break below the $20K support level.
The RSI indicator is also showing values below 50% at the moment. This indicates that the bears are in control once again, and the price’s momentum is bearish, further boosting the probability of a bearish continuation.
On-chain Analysis
Bitcoin Miner Reserve
Bitcoin miners are key participants in the market, and their behavior can heavily influence the price. Aside from having large amounts of BTC, they also help secure the network, which is considered more valuable.
Looking at the Bitcoin Miner Reserve chart, it is evident that the miners have been under heavy pressure. The price has dropped as low as $18K, and there’s potential to experience even lower levels in the short term. This massive downtrend has caused the miners to sell more and more of their mined Bitcoin to cover their costs of operation in the last few months. The Miner Reserve metric is demonstrating these outcomes with a downtrend since early August.
The uncertainty surrounding whether the miners can continue their operations or not would take its toll on the market sentiment. Also, their selling pressure could overflow the market with supply and push the price even lower in the short term.


 Bitcoin
  Ethereum
  Tether
  USDC
USDC  Dogecoin
  Cardano
  Bitcoin Cash
  Litecoin
  Polygon
  LEO Token
  Hedera
  Stellar
  Cosmos Hub
  OKB
OKB  Maker
Maker  Algorand
  NEO
NEO  Gate
Gate  KuCoin
  Synthetix Network
  IOTA
IOTA  Tether Gold
  TrueUSD
  Enjin Coin
  Ravencoin
  Holo
Holo  0x Protocol
  Siacoin
  Basic Attention
  Zcash
Zcash  Ontology
  Decred
  Lisk
Lisk  Waves
Waves  DigiByte
  Status
  Numeraire
  Nano
Nano  Pax Dollar
  Steem
Steem  OMG Network
  BUSD
BUSD  Ren
Ren  Bytom
Bytom  Bitcoin Diamond
  HUSD
HUSD  Energi
  Augur
Augur