


Can Ethereum (ETH) Price Regain Footing Ahead of Testnet Release?

The Ethereum (ETH) price is trading below an important resistance area at $1,690. Whether it reclaims it or gets rejected could determine the future trend’s direction.
In the news last week, Ethereum developers stated that they want to build a new testnet to solve the issue of token distribution for developers that currently use the Goerli Testnet. The CEO of Polygon said that Layer 1 protocols are the future of the blockchain ecosystem, and the Ethereum blockchain is the most important one.
Finally, the most important piece of Ethereum news is that the Shapella hard fork will activate on Feb. 28 and test validator staking withdrawals.
Ethereum (ETH) Price Fails to Break Out Above Long-Term Resistance
The technical analysis for Ethereum’s weekly chart is mostly bullish. This is evident by the bullish engulfing candlestick two weeks ago (green icon). While the ETH price was rejected last week (red icon), it did not negate the bullish engulfing candlestick. However, the price of ETH has yet to break out of a descending resistance line that has been in place since the all-time high.
Despite this, the weekly RSI has broken through its descending resistance line. Similar price breakouts frequently follow this. As a result, the price of ETH may break out and rise toward an average price of $2,000. However, if the rejection continues, the price of Ethereum could fall to $1,200.
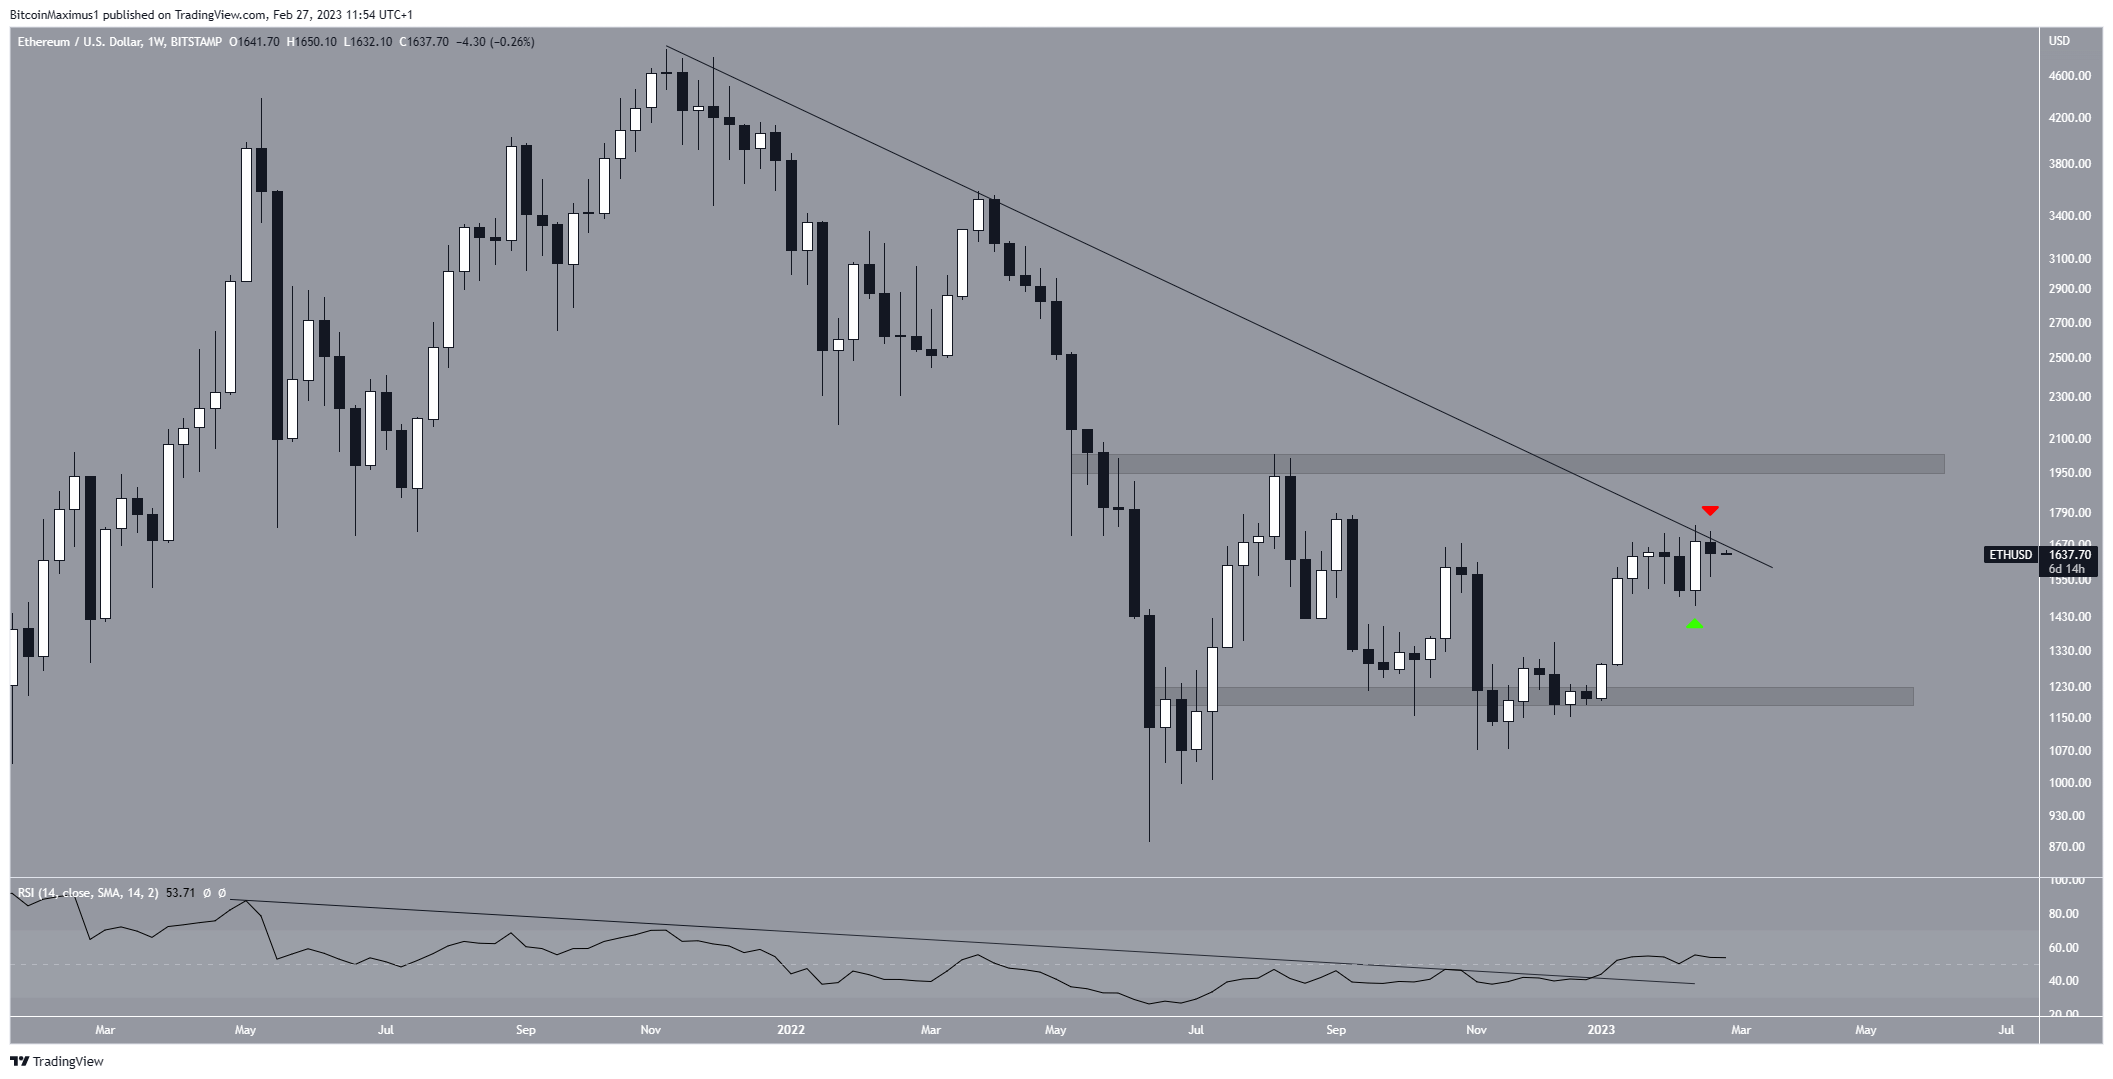
ETH/USD Weekly Chart. Source: TradingView
Ethereum (ETH) Price Prediction for March Is Undetermined
The Ethereum price prediction for March is still undetermined. The reasons for this are the conflicting price action and technical indicator readings.
On the bearish side, the ETH price deviated above the $1,660 horizontal resistance area (red circle). Downward movements often follow such deviations.
On the bullish side, ETH created a bullish engulfing candlestick on Feb. 26 (green icon). Moreover, the daily RSI broke out from its bearish divergence trend line (green line) and is now above 50.
There is a confluence of support levels at $1,490. It is created by the 0.382 Fib retracement support level, a horizontal support area, and the middle of an ascending parallel channel from which ETH previously broke out.
Therefore, whether the price breaks down below this area or reclaims the $1,660 resistance could determine the future trend. The former could lead to a drop toward $1,200 while the latter could lead to an increase above $2,000.
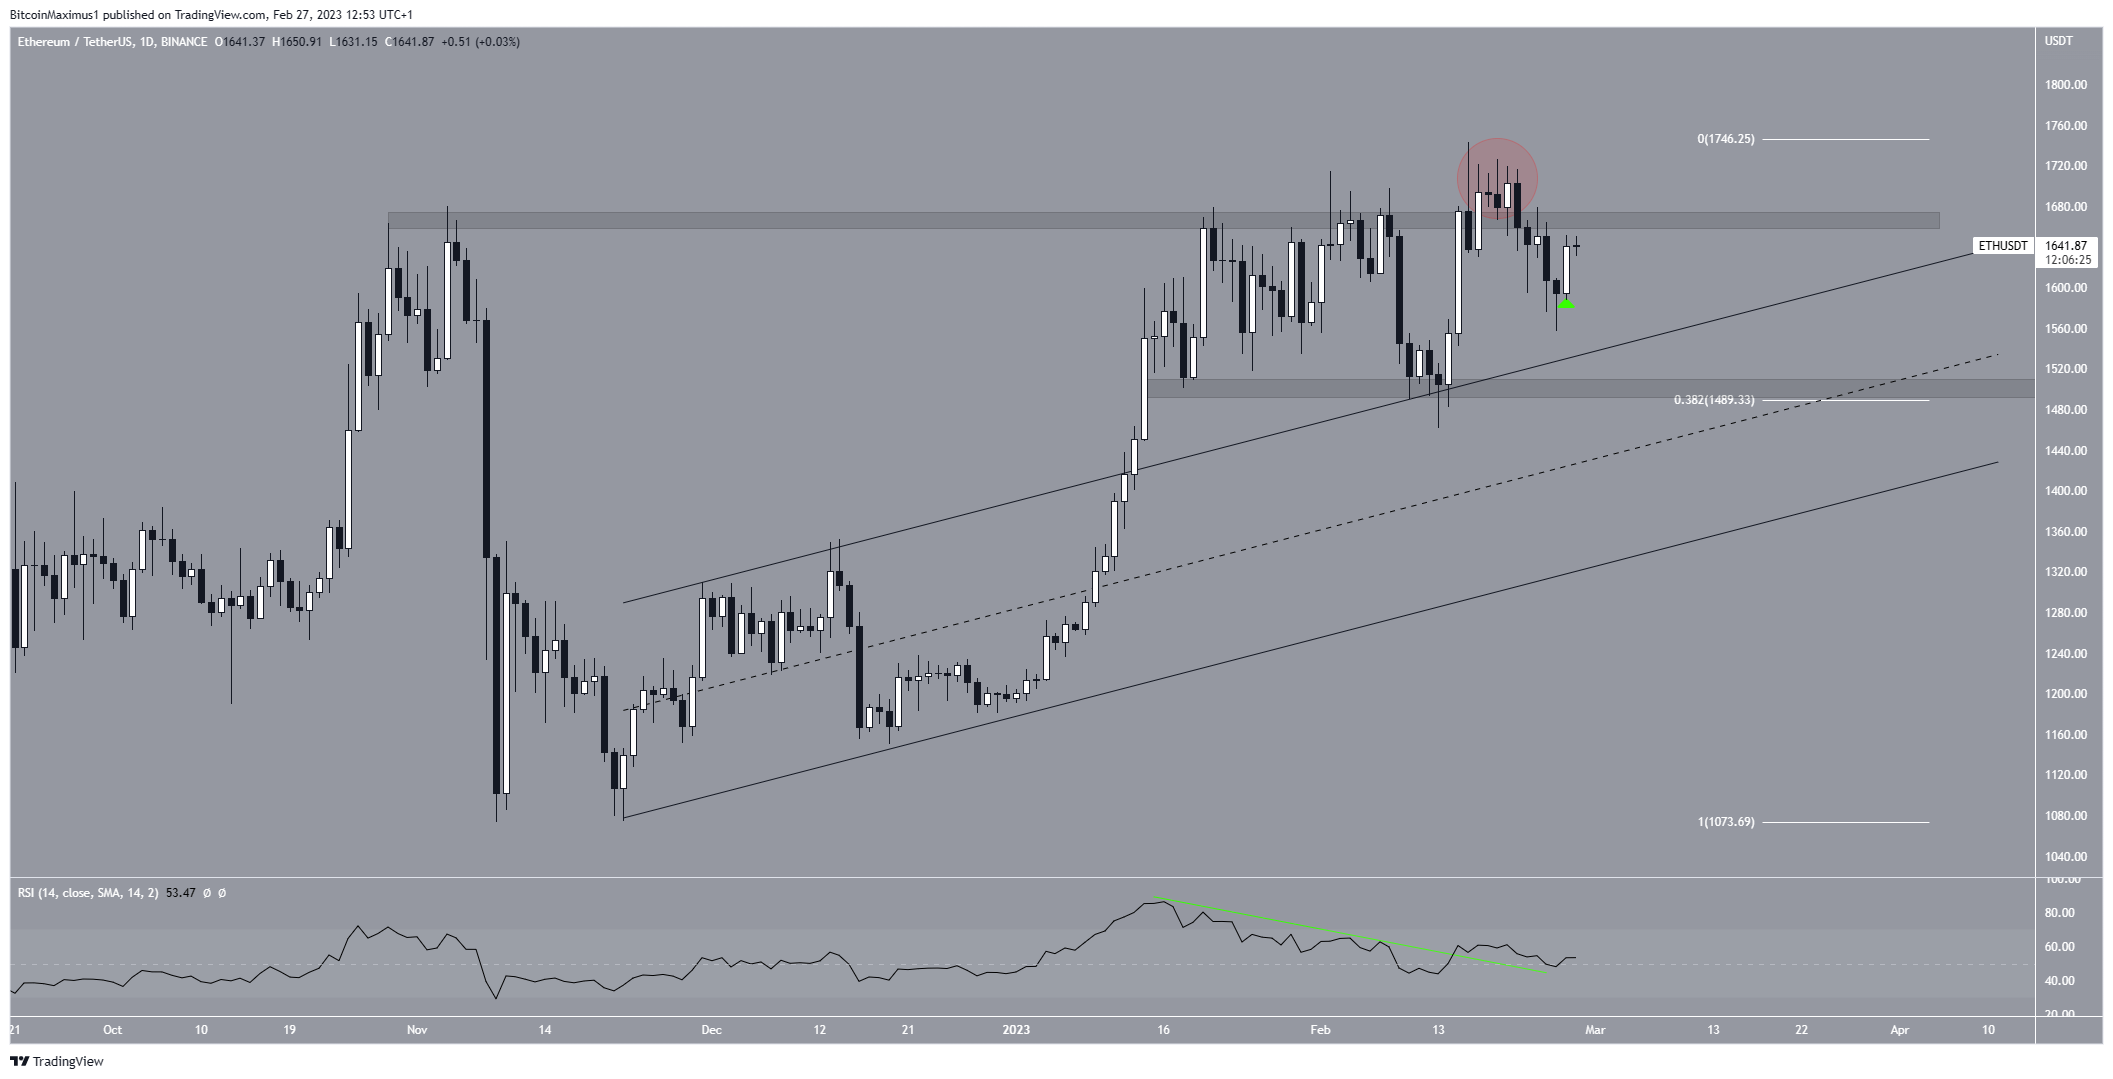
ETH/USDT Daily Chart. Source: TradingView
To conclude, the Ethereum price forecast for March is still unclear. Whether the ETH price closes above $1,690 or below $1,490 could determine the future long-term trend.
For BeInCrypto’s latest crypto market analysis, click here.


 Bitcoin
  Ethereum
  Tether
  USDC
USDC  Dogecoin
  Cardano
  Bitcoin Cash
  Polygon
  Litecoin
  LEO Token
  Hedera
  Cosmos Hub
  Stellar
  OKB
OKB  Maker
Maker  Algorand
  NEO
NEO  Gate
Gate  KuCoin
  Synthetix Network
  IOTA
IOTA  Tether Gold
  TrueUSD
  Ravencoin
  Enjin Coin
  Holo
Holo  Siacoin
  0x Protocol
  Basic Attention
  Zcash
Zcash  Decred
  Ontology
  Lisk
Lisk  Waves
Waves  DigiByte
  Numeraire
  Nano
Nano  Status
  Pax Dollar
  Steem
Steem  OMG Network
  BUSD
BUSD  Ren
Ren  Bytom
Bytom  Bitcoin Diamond
  HUSD
HUSD  Energi
  Augur
Augur