


ETH Technical Analysis: Bullish Revival Targets At $1700

According to the technical analysis, ETH prices show a bullish reversal from the $1400 resulting in a 12% jump to challenge the 50-day EMA to reach the $1700 mark. The 30% drop in the ETH prices takes a bullish reversal from the $1400 support level resulting in a 12% recovery in the last four days. The reversal rally challenges the support trendline and the 50-day SMA to maintain the bullish trend. So, will the bullish trend result in a trendline breakout entry for sideline buyers?
Key Points:
- The ETH prices revert by 12% from the $1400 support level.
- The reversal rally may shortly give a bullish breakout of the resistance trendline.
- With a market cap of $193 billion, the intraday trading volume of Ethereum has increased by 24% to reach $23.05 billion.
Source — Tradingview
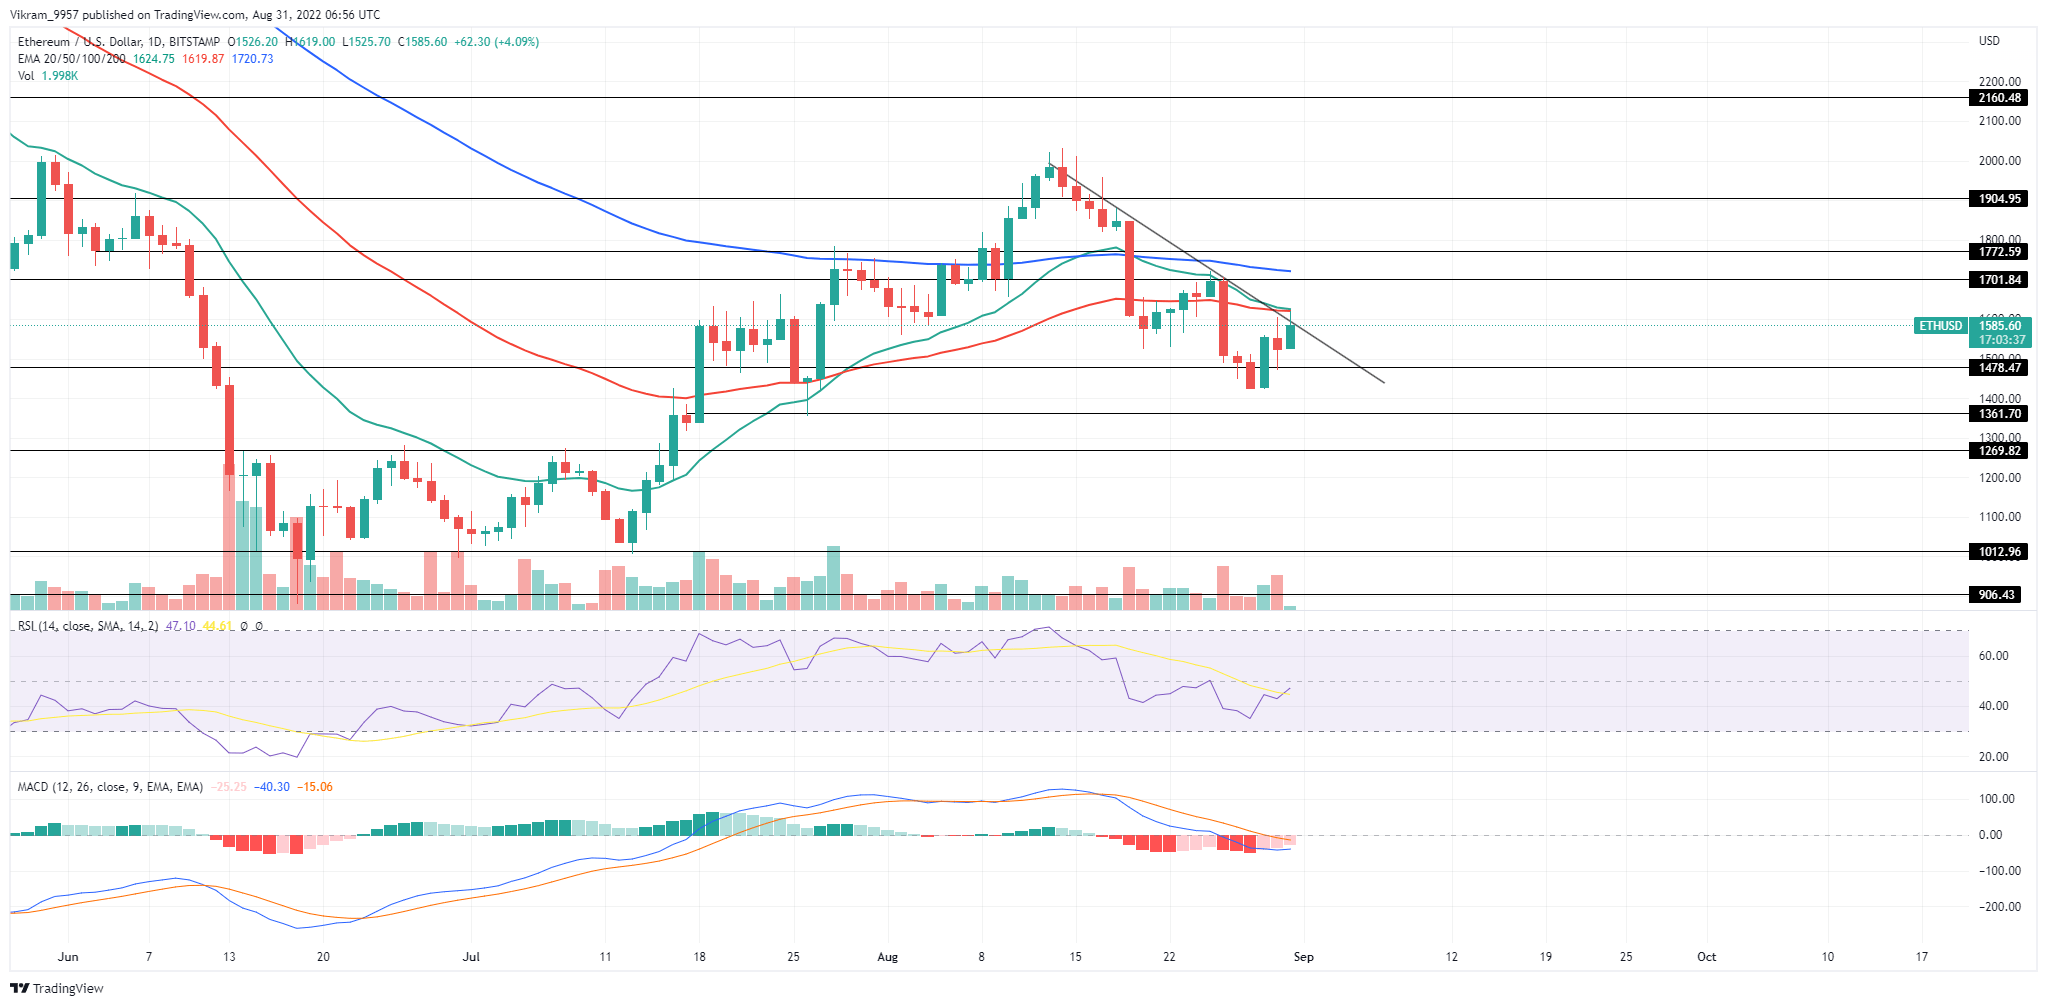
ETH Technical Analysis
ETH prices maintain a downward trend in the daily chart after facing rejection at the psychological mark of $2000. The falling prices lead to the generation of a resistance trendline which keeps the bullish growth in check and accounts for a 30% price drop. The recent bullish reversal starting after the bullish engulfing candle of 8.99% on 29th August challenges the resistance trend line and a 50-day SMA. However, the higher price reduction in the daily candle delays the breakout entry for sideline traders. The reversal rally finds the support of the increased intraday trading volume supporting the possibility of a bullish breakout. A Bullish break out of the resistant trendline will result in a price jump to the overhead resistance of $1700. Furthermore, an increase in buying pressure may drive the uptrend higher to the $1900 resistance level. Conversely, a bearish turnaround from the resistance trendline might break the $1400 support level to test the $1361 support level.
Technical Indicators
The RSI slope shows a diagonal trend in the nearly oversold zone, crossing the 14-day average line. The MACD indicator showcases the fast and slow line on the verge of giving a bullish crossover as bearish histograms decline. Hence the technical indicators display an increase in the underlying bullishness, raising the possibility of a trade line break out. The unleashed bullish momentum will fuel the bullish trend in ETH prices. Resistance Levels: $1700 and $1900 Support Levels: $1400 and $1361


 Bitcoin
  Ethereum
  Tether
  USDC
USDC  Dogecoin
  Cardano
  Bitcoin Cash
  Polygon
  Litecoin
  LEO Token
  Hedera
  Cosmos Hub
  Stellar
  OKB
OKB  Maker
Maker  Algorand
  NEO
NEO  Gate
Gate  KuCoin
  Synthetix Network
  IOTA
IOTA  Tether Gold
  TrueUSD
  Enjin Coin
  Holo
Holo  0x Protocol
  Ravencoin
  Siacoin
  Basic Attention
  Zcash
Zcash  Decred
  Ontology
  Lisk
Lisk  Waves
Waves  DigiByte
  Status
  Nano
Nano  Pax Dollar
  Numeraire
  Steem
Steem  OMG Network
  BUSD
BUSD  Ren
Ren  Bitcoin Diamond
  Bytom
Bytom  HUSD
HUSD  Energi
  Augur
Augur