


Ethereum (ETH) Price: Are Bulls or Bears Winning the Battle?

The Ethereum (ETH) price has fallen since the beginning of April, when it deviated above a crucial long-term horizontal resistance.
While this could lead to more downside, both a bullish and bearish wave count are still valid. So, the direction of the long-term trend is still unclear.
Ethereum Price Fails to Sustain Increase
ETH is the native token of the Ethereum blockchain, created by Vitalik Buterin. The weekly time frame outlook leans on bearish, but also provides some mixed signs.
At the beginning of April, the Ethereum price reached a yearly high of $2,151, seemingly moving above the $1,950 resistance area. However, after a significant decrease the next week, the price fell below the area and validated it as resistance (red icon).
So, the previous breakout is now considered invalid. This movement is considered bearish since buyers could not sustain the increase. The closest support area is at $1,600.
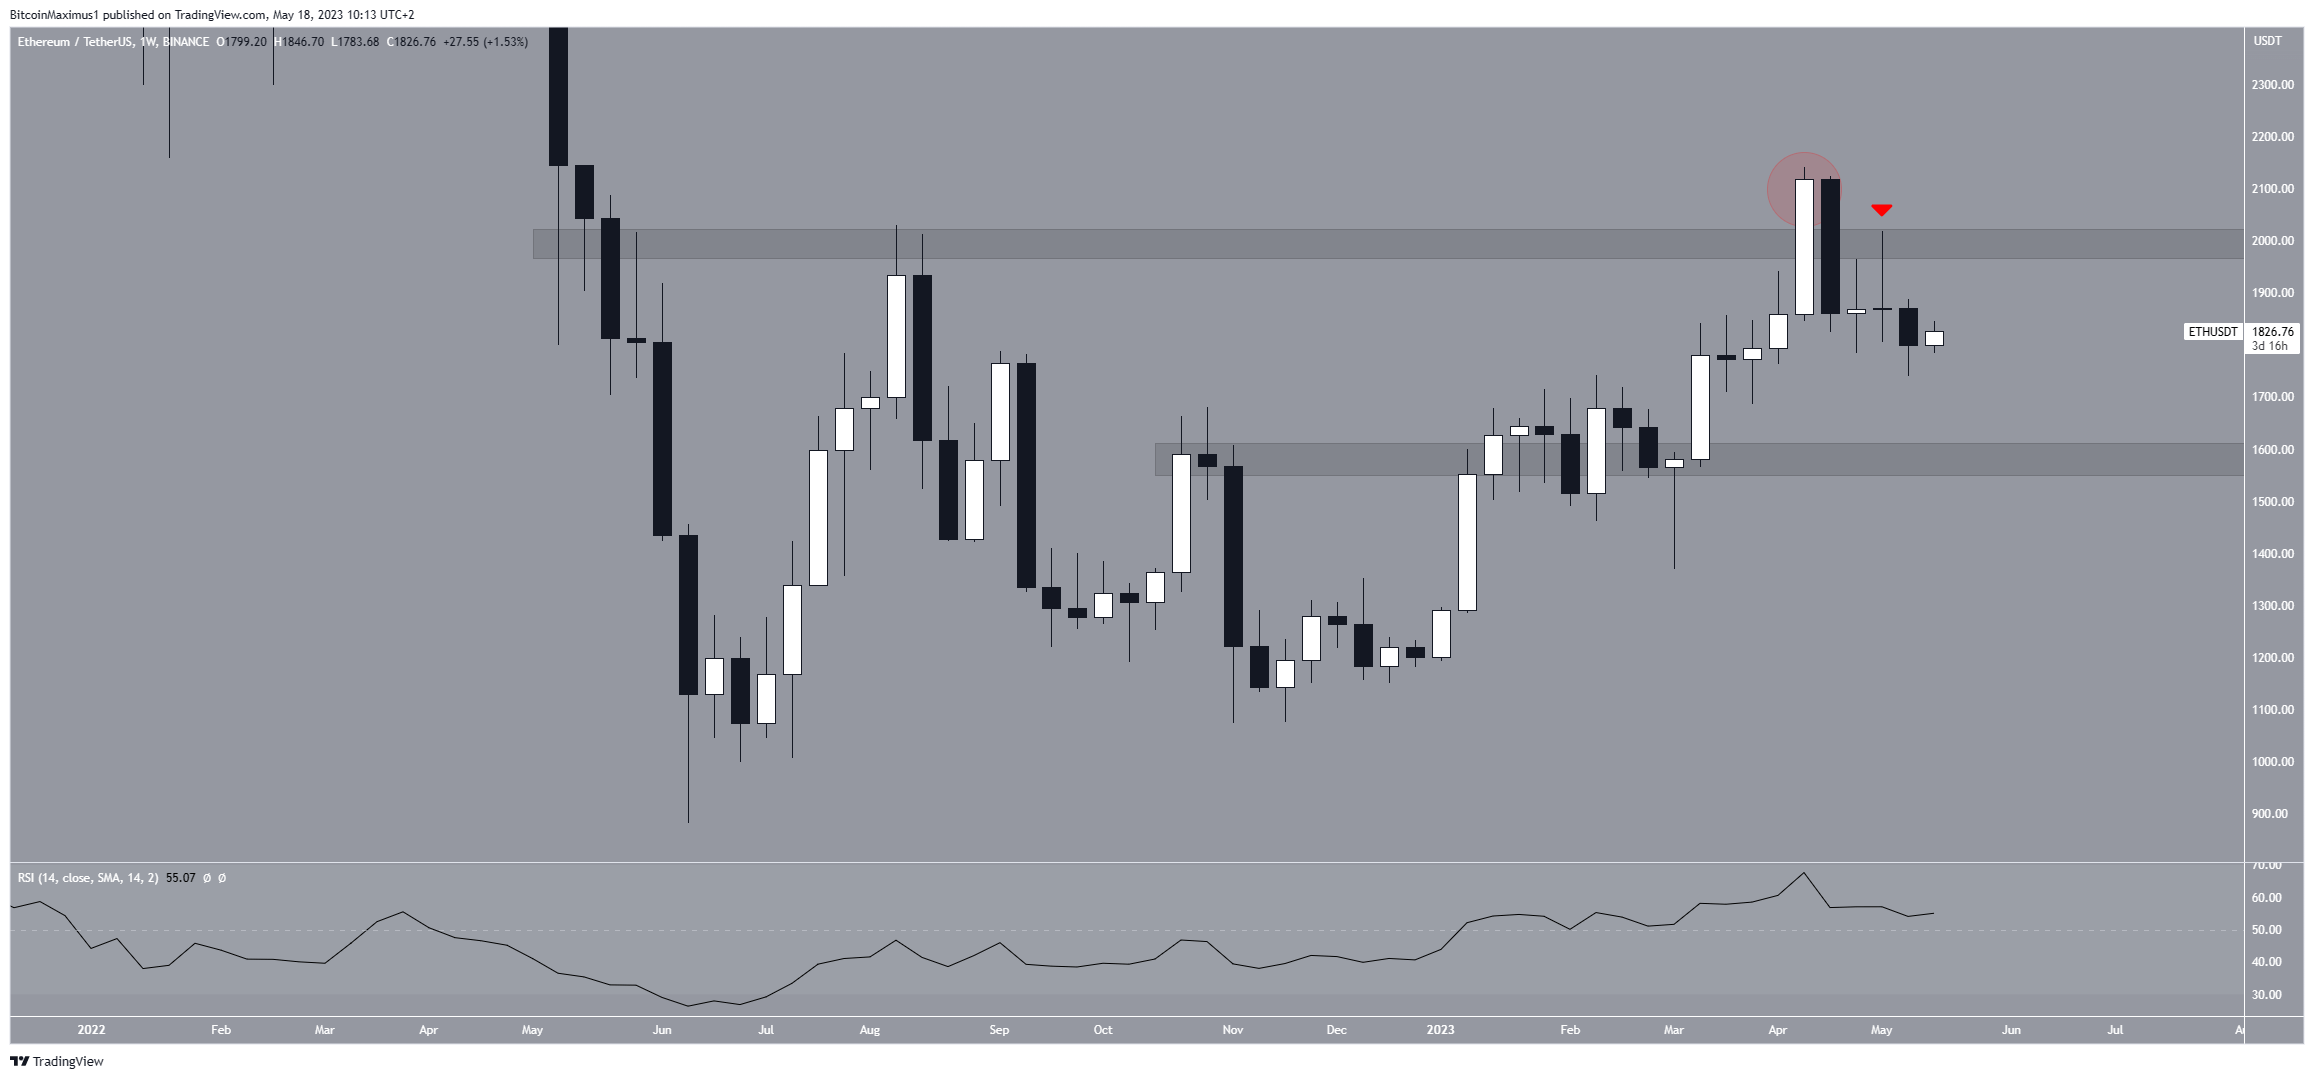
ETH/USDT Weekly Chart. Source: TradingView
However, the weekly Relative Strength Index (RSI) is still bullish. The RSI is a momentum indicator used by traders to evaluate whether a market is overbought or oversold and to determine whether to accumulate or sell an asset.
Readings above 50 and an upward trend suggest that bulls still have an advantage, while readings below 50 indicate the opposite. The current reading above 50 is considered a sign of a bullish trend.
ETH Price Prediction: What Does the Wave Count Say?
Two potential wave counts exist for the future Ethereum (ETH) price. The first one is bearish, stating that the price has completed an A-B-C corrective structure. If so, a significant downward movement that takes the price to new lows will follow.
Utilizing the Elliott Wave theory, technical analysts examine long-term price patterns and investor psychology that recur to determine the direction of a trend.
In this potential count, waves A:C has an exactly 1:1 Fib ratio, which is the most common in such structures. The ETH price will eventually drop below $1,000 if the count is correct.
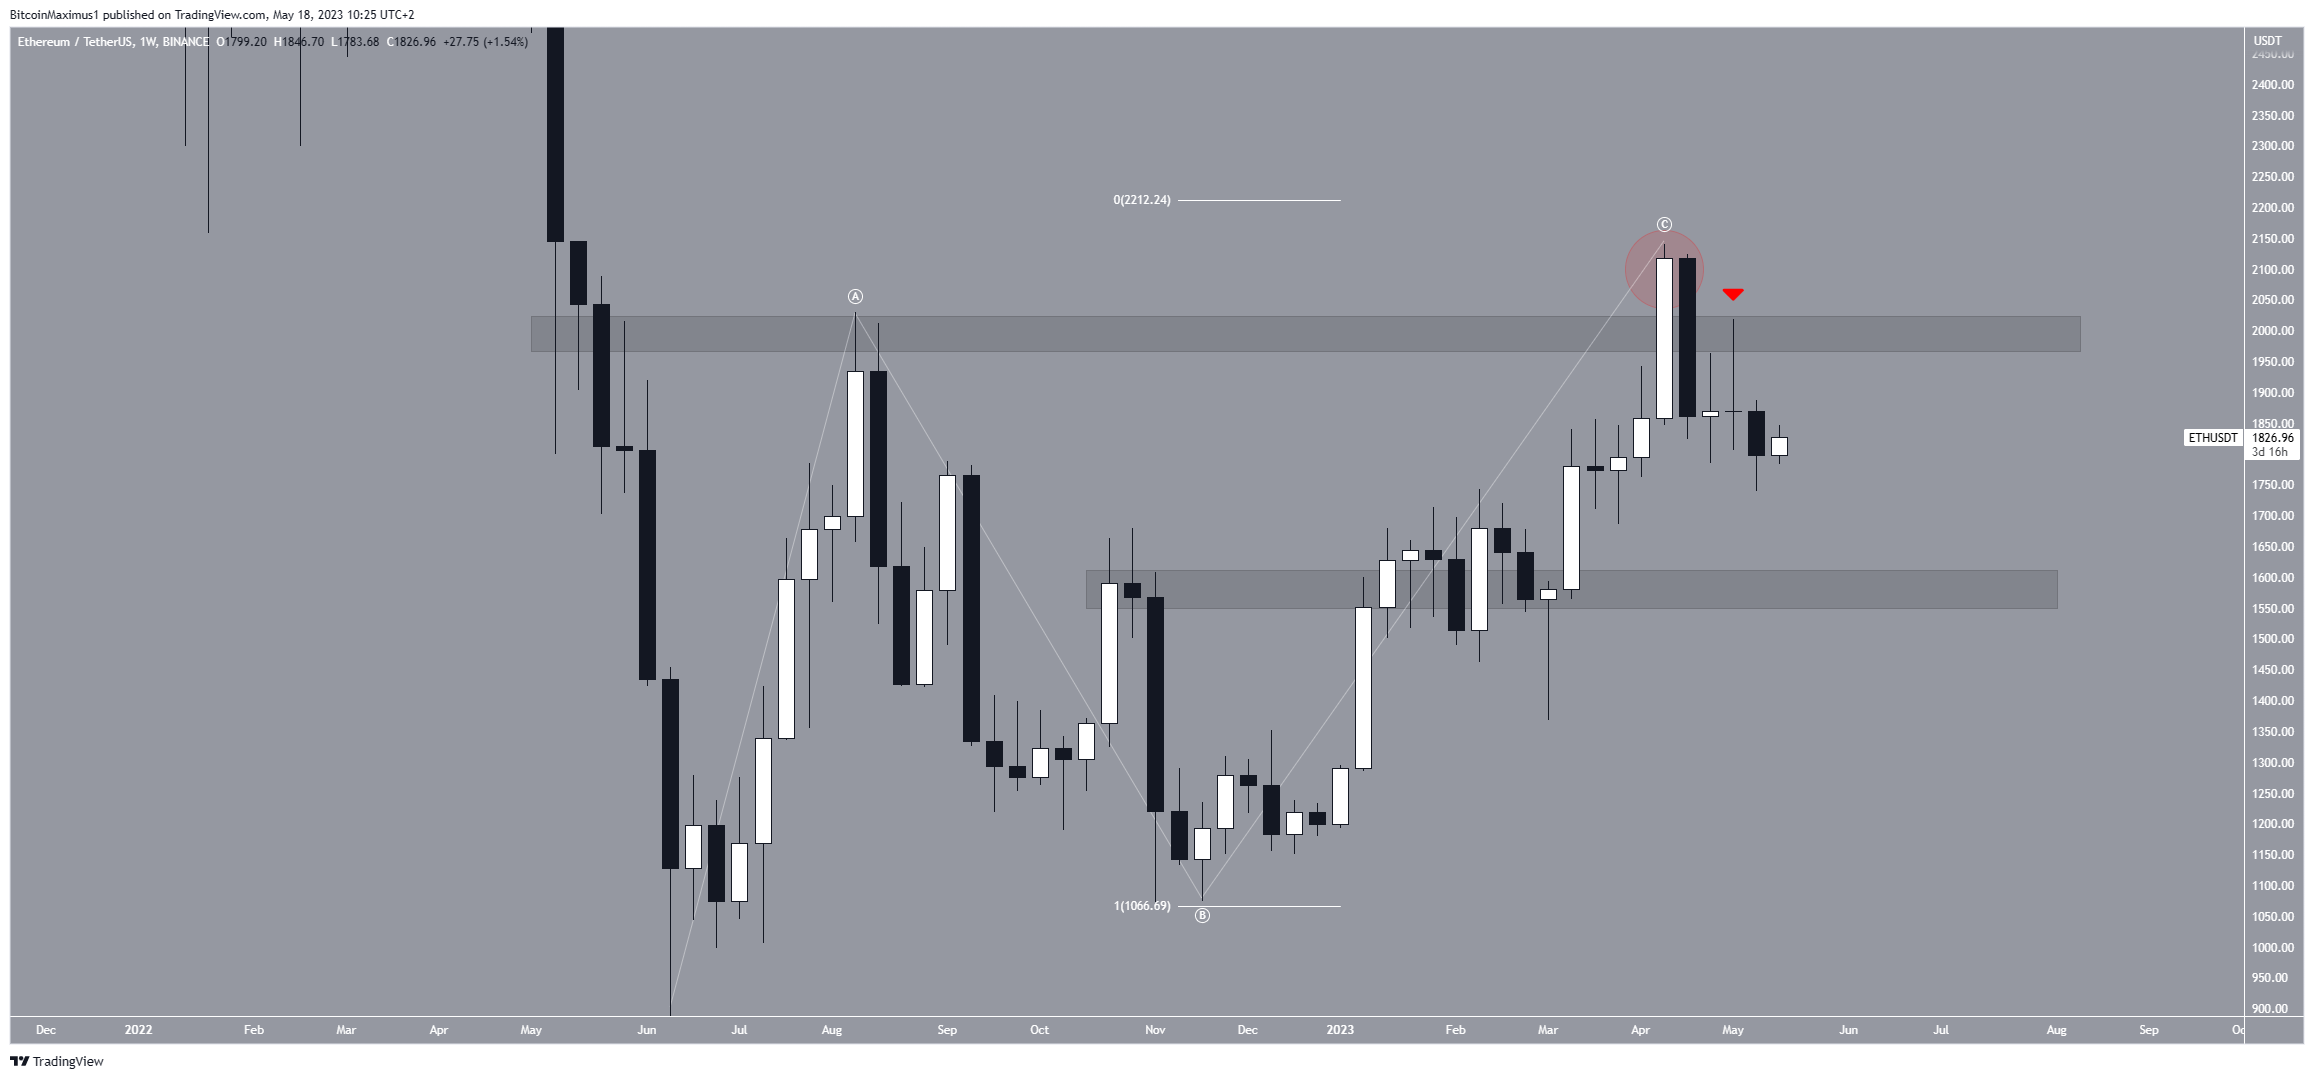
ETH/USDT Weekly Chart. Source: TradingView
The bullish count suggests that the increase is a bullish 1-2/1-2 wave structure. This means that the price is in sub-wave two (white) of wave three (black).
This is an extremely bullish count in which the slope of the increase accelerates once the price begins sub-wave three.
In order for the count to be correct, ETH has to bounce at the $1,600 support area and initiate a sharp upward movement above $2,000.
Since the second 1-2 should have a steeper slope than the first one, a breakdown below the slope of the first one (black) will invalidate the count.
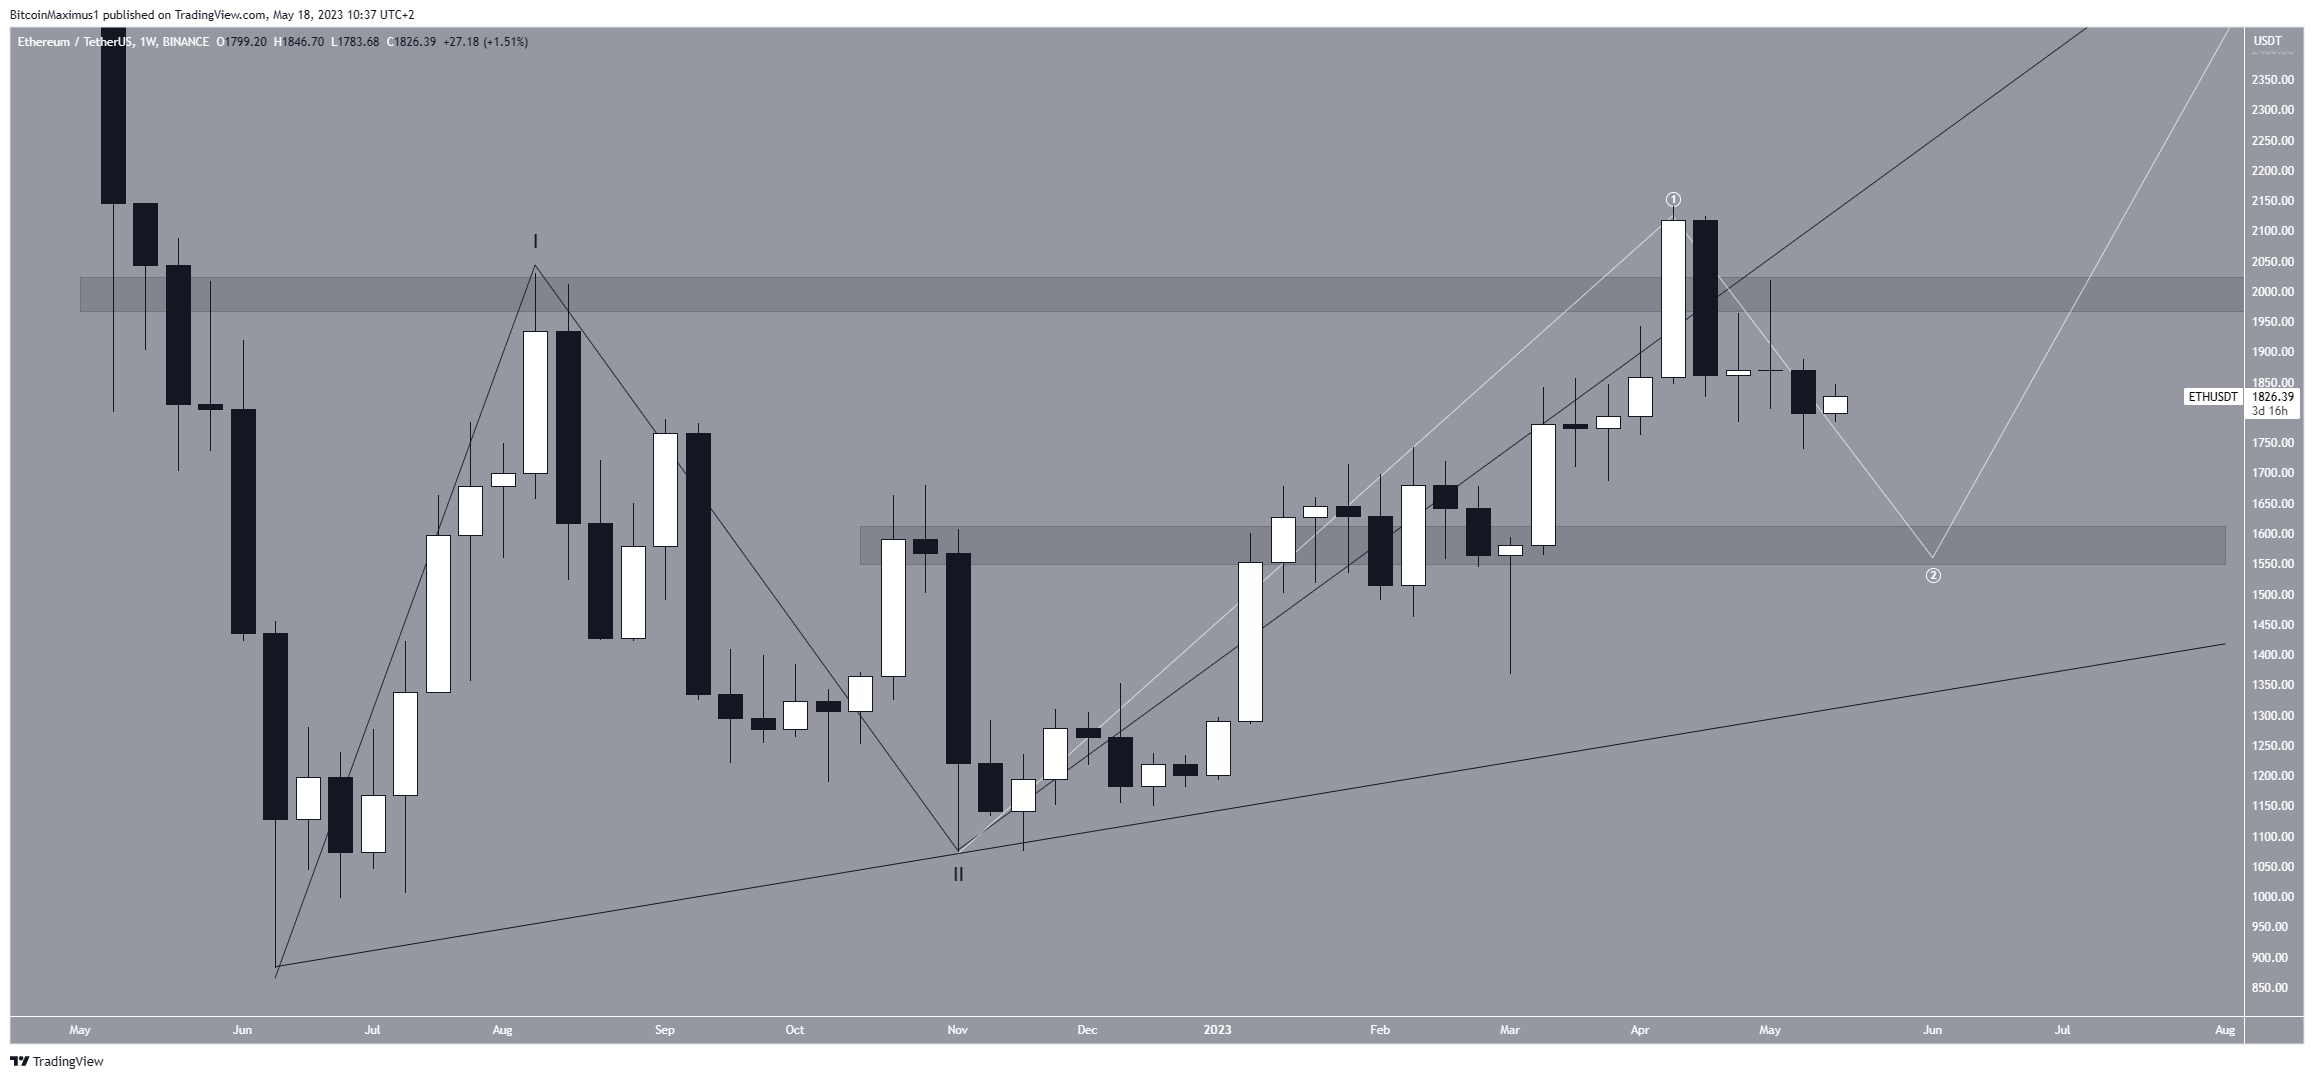
ETH/USDT Weekly Chart. Source: TradingView
To conclude, the future ETH price trend will be determined by whether the price breaks down below $1,600 or moves above $1,950.
In the case of the former, a decrease toward at least $1,000 will be expected. However, the ETH price can move to $2,500 in the case of the latter.


 Bitcoin
  Ethereum
  Tether
  USDC
USDC  Dogecoin
  Cardano
  Bitcoin Cash
  Polygon
  Litecoin
  LEO Token
  Hedera
  Cosmos Hub
  Stellar
  OKB
OKB  Maker
Maker  Algorand
  NEO
NEO  Gate
Gate  KuCoin
  Synthetix Network
  IOTA
IOTA  Tether Gold
  TrueUSD
  0x Protocol
  Enjin Coin
  Siacoin
  Ravencoin
  Holo
Holo  Basic Attention
  Zcash
Zcash  Decred
  Ontology
  Lisk
Lisk  Waves
Waves  DigiByte
  Numeraire
  Nano
Nano  Status
  Pax Dollar
  Steem
Steem  OMG Network
  BUSD
BUSD  Ren
Ren  Bytom
Bytom  Bitcoin Diamond
  Augur
Augur  HUSD
HUSD  Energi