


Ethereum (ETH) Price Falls Sharply Despite Merge Set for Early September

Despite the Ethereum merge being expected to reduce emissions by 88% and potentially make ETH deflationary, the price has fallen considerably in August.
Ethereum has been falling underneath a descending resistance line since reaching an all-time high price of $4,868 in November 2021. The downward move has so far led to a local low of $880 in June 2022. The low also coincided with a new all-time low in the weekly RSI (green circle).
The price rebounded shortly after, causing the RSI to move outside of its oversold territory.
The relief rally culminated with a local high of $2,031 on Aug. 14, 2022 (red icon) and ETH has been falling since. The top served to validate the $1,920 area as resistance (red icon).
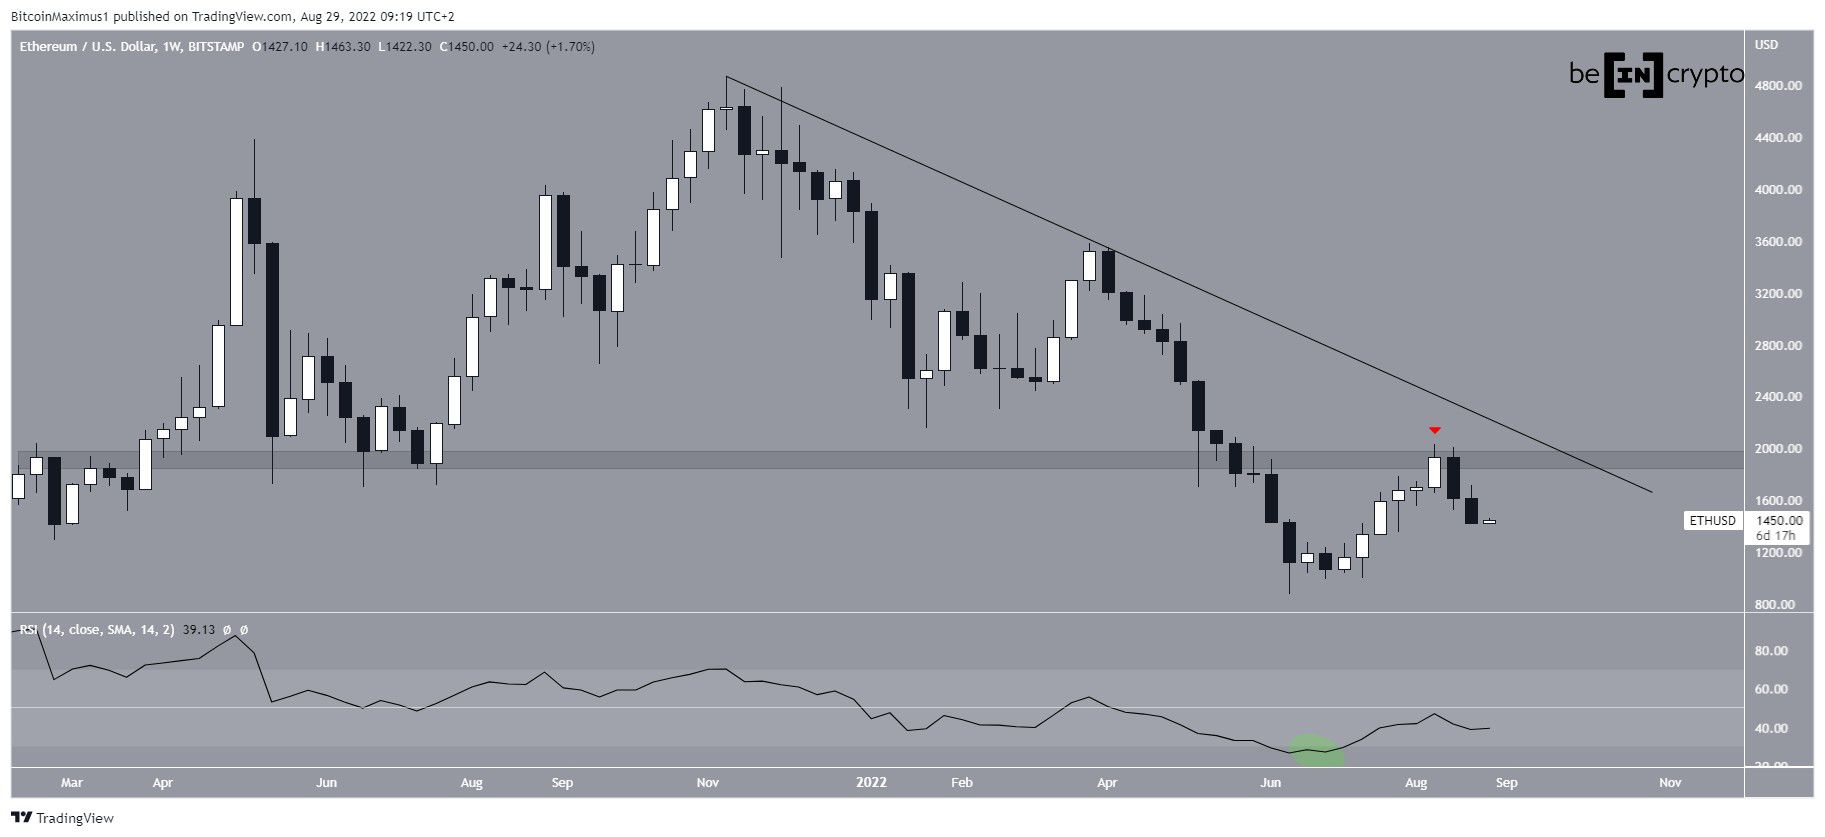
ETH/USD Chart By TradingView
Falling from resistance
The readings from the daily chart support the validity of the rejection from the weekly chart. The reason for this is that the RSI broke down from an ascending support line after the price reached the aforementioned Aug. 14 high.
If the downward movement continues, there is a confluence of support levels found between $1,250 and $1,330. This support is created by:
- The 0.618 Fib retracement support level (white)
- A horizontal support area
- A potential ascending support line (dashed)
The line has not yet been validated enough times, so its exact slope remains uncertain.
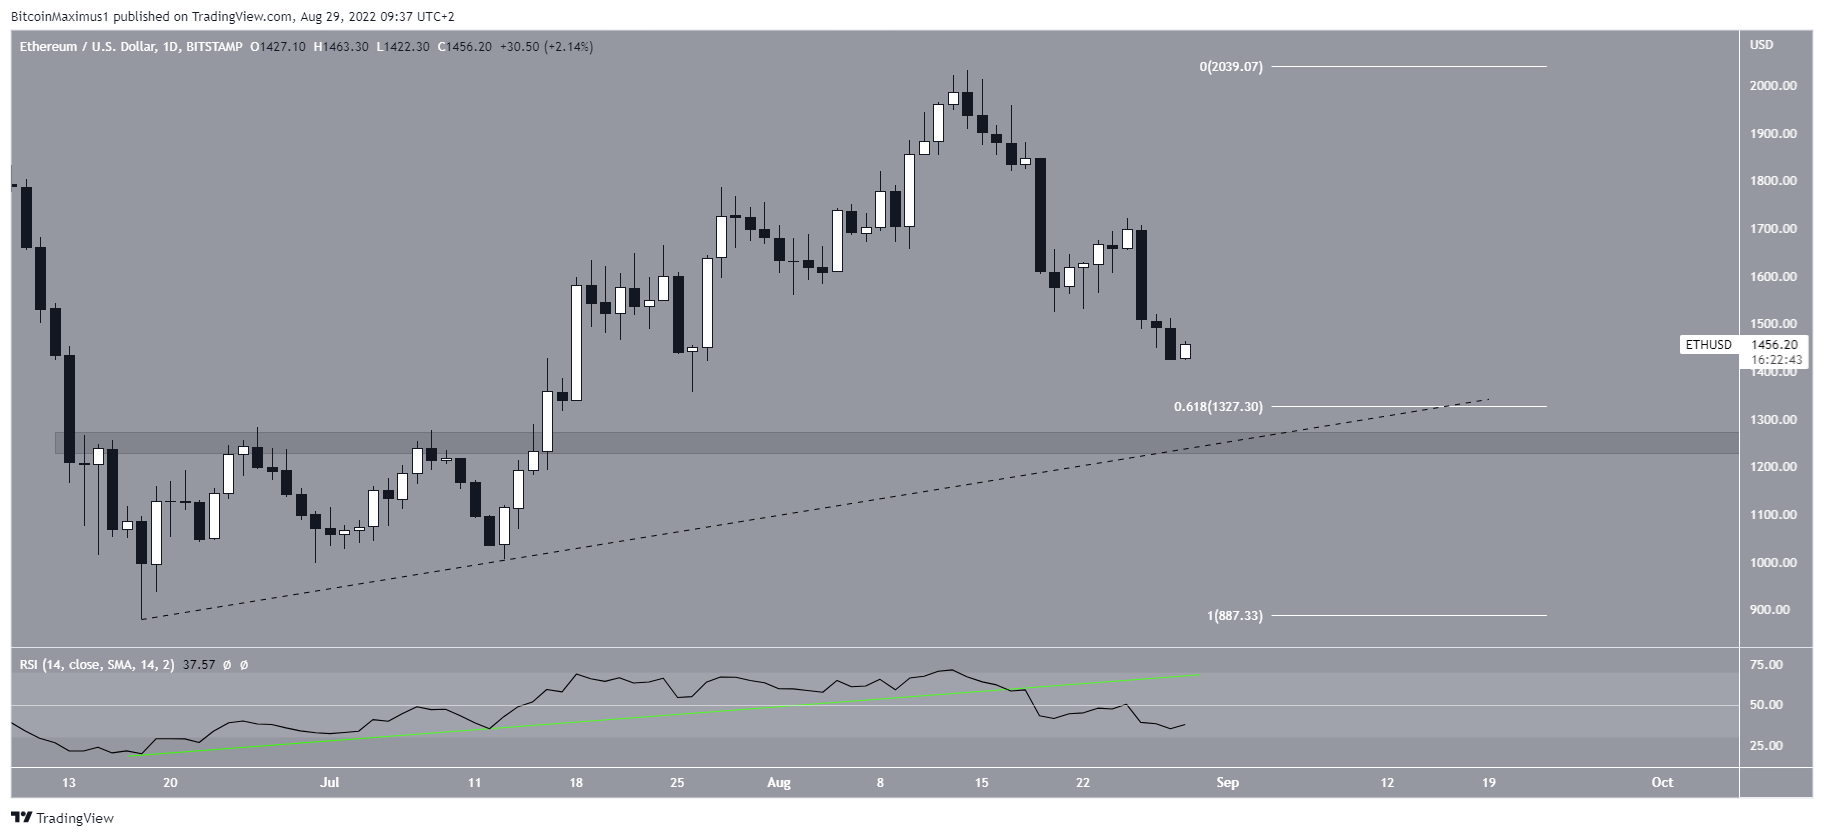
ETH/USD Chart By TradingView
Future ETH trajectory
The most likely wave count suggests that since the June low, Ethereum completed a five-wave upward move.
If so, it is likely forming an A-B-C corrective structure and is close to the bottom of wave A.
The six-hour RSI has begun to generate a bullish divergence (green line). If the divergence materializes, it could cause a breakout from a short-term descending resistance line and initiate the beginning of wave B.
If correct, the count would suggest that ETH will reach a high between $1,730 and $1,800 before decreasing to complete wave C.
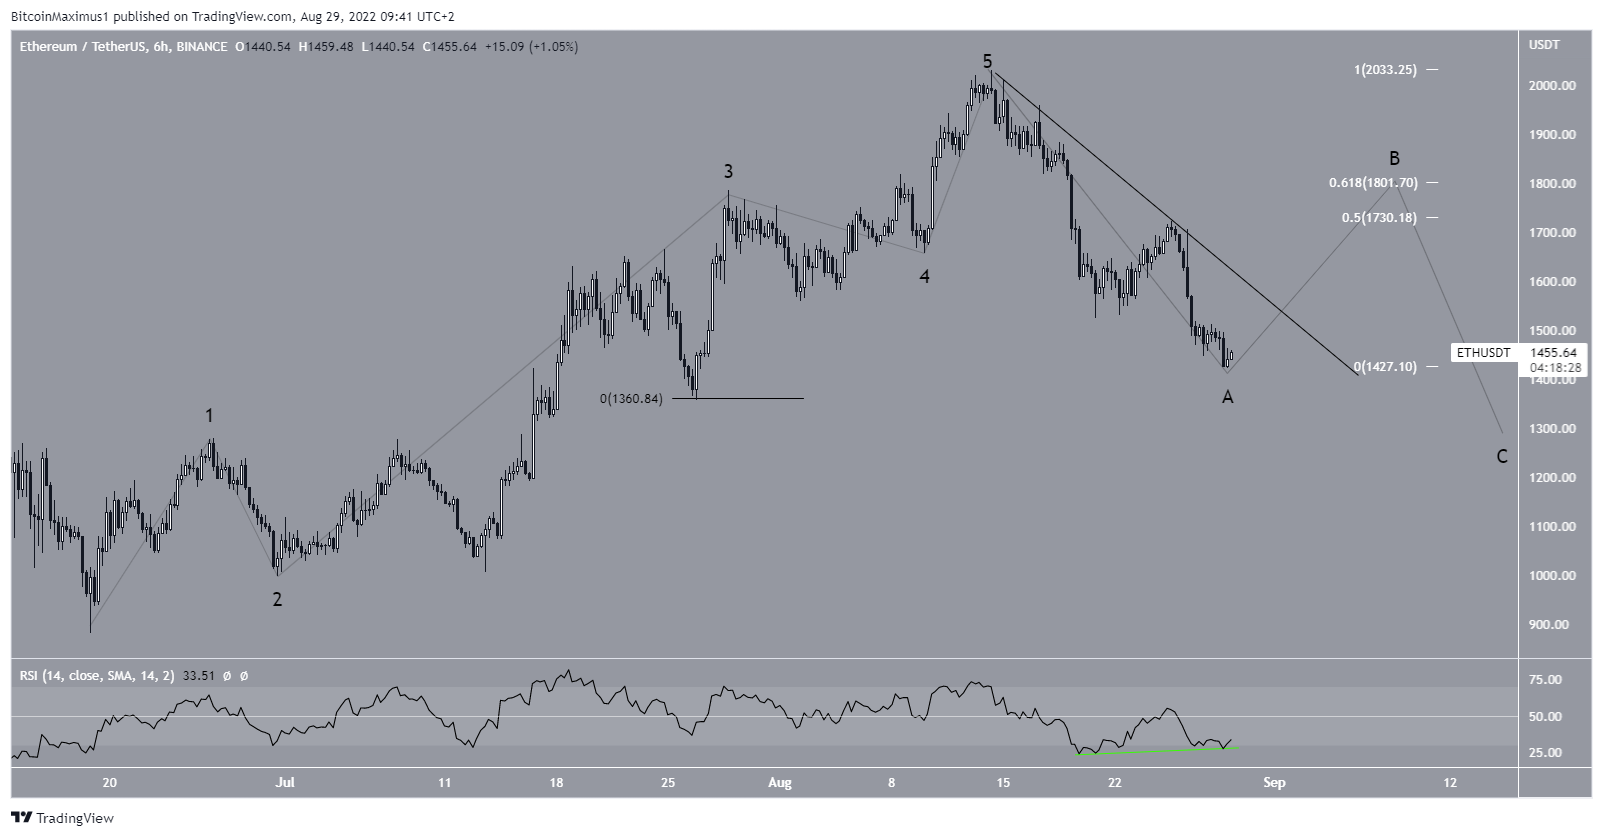
ETH/USDT Chart By TradingView
For Be[in]Crypto’s latest Bitcoin (BTC) analysis, click here


 Bitcoin
  Ethereum
  Tether
  USDC
USDC  Dogecoin
  Cardano
  Bitcoin Cash
  Polygon
  Litecoin
  LEO Token
  Hedera
  Cosmos Hub
  Stellar
  OKB
OKB  Maker
Maker  Algorand
  NEO
NEO  Gate
Gate  KuCoin
  Synthetix Network
  IOTA
IOTA  Tether Gold
  TrueUSD
  0x Protocol
  Enjin Coin
  Ravencoin
  Siacoin
  Holo
Holo  Basic Attention
  Zcash
Zcash  Decred
  Lisk
Lisk  Ontology
  Waves
Waves  DigiByte
  Numeraire
  Nano
Nano  Status
  Pax Dollar
  Steem
Steem  OMG Network
  BUSD
BUSD  Ren
Ren  Bytom
Bytom  Bitcoin Diamond
  Augur
Augur  Energi
  HUSD
HUSD