


Ethereum price analysis: Bears overtake bullish pressure at $1,875 after a market crash

The latest Ethereum price analysis shows a downtrend in todays market. The ETH coin is currently trading at around $1,875, with a notable drop of 1.24 percent in the past 24 hours. The ETH token opened today at $1,905 and quickly started its downward journey, with no signs of a reversal yet.
The selling pressure is escalating as the market sentiment is overwhelmingly bearish. The support level at $1,857 is seemingly not enough to contain the sell-off, and it looks like ETH will continue to fall further if no bullish momentum appears in the market.
The resistance level at $1,917 appears to be too strong for the rising buying pressure, and any attempts to break it have been unsuccessful so far. This could mean that Ethereum may have a hard time recovering from this bearish trend in the short term.
Ethereum price analysis 24-hour chart: Bearish trend aggravates as ETH slumps down
The 24-hour Ethereum price analysis shows a strong bearish trend in the market. The red candlestick is a strong indication of the increased selling pressure. The bullish pressure has been unable to push the price up, and as a result, Ethereum is continuing its downward journey.
The market cap plummeted to around $225 billion, with a strong loss of 1.24 percent. It appears that the buyers are still not able to gain any traction, with the selling pressure clearly dominating the market. The 24-hour trading volume of the ETH coin is valued at $8,545,648,586, with a fall of 17.54 percent.
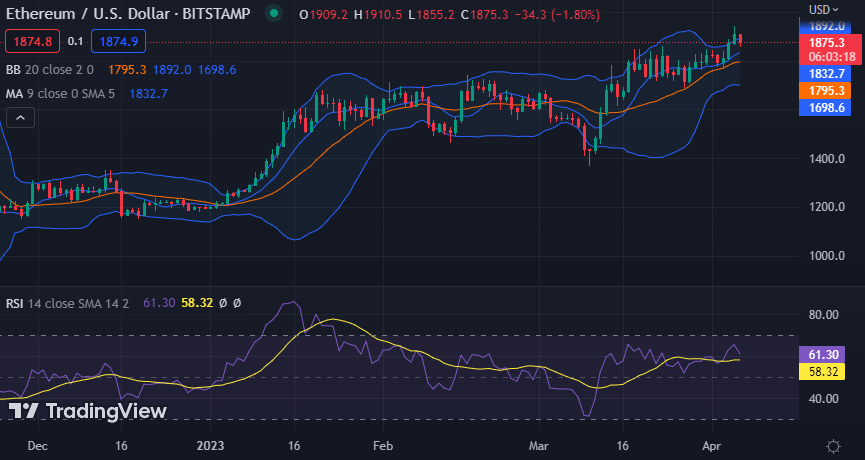
ETH/USD 24-hour chart. Source: TradingView
The MACD indicator on the daily chart is also bearish, with the MACD line crossing below the signal line and further extending its downward trajectory. The Bollinger bands appear to converge, indicating a period of low volatility in the market. The upper band is currently at $1,892 and the lower band is at $1,698. The Relative Strength Index (RSI) is at a 61.30, which suggests that the market is heading to overbought region and a rebound could be expected soon.
Ethereum price analysis hourly chart: Recent developments and further technical indications
The four hour Ethereum price analysis is showing signs of strengthening of the bearish momentum as the price underwent further decline during the last four hours. Although a downtrend has been dominating the charts, the bulls have shown their last presence at the end of the previous trading session. Today, the bears have succeeded in taking the lead back, and all the candlesticks for today are red.
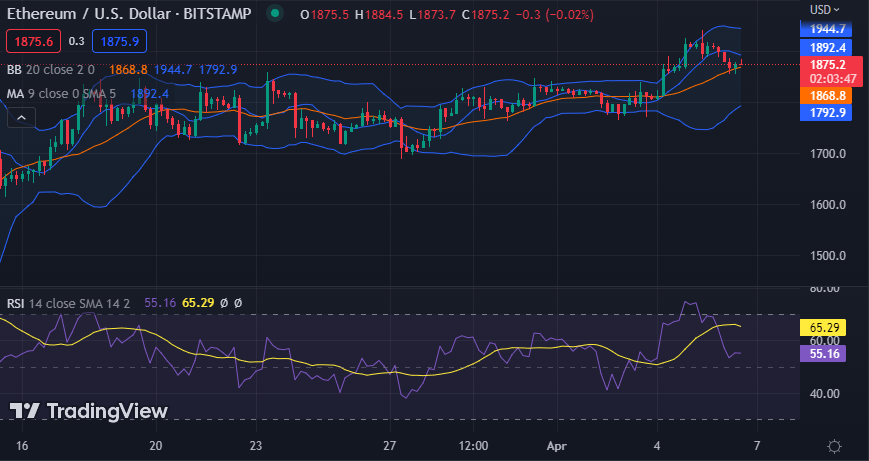
ETH/USD 4-hour chart. Source: TradingView
The price level is still below the moving average (MA) value, which is standing at 1,892 for now. The Bollinger Bands on the hourly chart are also converging, indicating a period of low volatility in the market. The upper Bollinger is currently at $1,944 which is far away from the current Ethereum price, while the lower band is at $1,792 which might act as a strong support level for the Ethereum price. The RSI is at 55.16, which shows that the market is still in the neutral region and ETH may soon experience a short-term rebound.
Ethereum price analysis conclusion
To sum up, Ethereum is currently experiencing an extended bearish trend which might continue for some more time. The support level at $1,857 is still valid and buyers might take advantage of the low price to enter the market. However, if the trend continues to remain bearish, then Ethereum will be witnessing further losses in the coming days. The technical indicators are also showing signs of the dominance of the bears in the market, and it looks like ETH will remain at its current price level or possibly drop further if no positive momentum appears soon.
While waiting for Ethereum to move further, see our Price Predictions on XDC, Cardano, and Curve.


 Bitcoin
  Ethereum
  Tether
  USDC
USDC  Dogecoin
  Cardano
  Bitcoin Cash
  Polygon
  Litecoin
  LEO Token
  Hedera
  Cosmos Hub
  Stellar
  OKB
OKB  Maker
Maker  Algorand
  NEO
NEO  Gate
Gate  KuCoin
  Synthetix Network
  IOTA
IOTA  Tether Gold
  TrueUSD
  Enjin Coin
  Ravencoin
  Holo
Holo  0x Protocol
  Siacoin
  Basic Attention
  Zcash
Zcash  Decred
  Ontology
  Lisk
Lisk  Waves
Waves  DigiByte
  Numeraire
  Nano
Nano  Status
  Pax Dollar
  Steem
Steem  OMG Network
  BUSD
BUSD  Ren
Ren  Bytom
Bytom  Bitcoin Diamond
  Augur
Augur  Energi
  HUSD
HUSD