


Ethereum Price Analysis: $ETH Price out of Market Correction Sets Recovery to $2000
Ethereum Price Prediction: After spending the last six weeks under a steady correction phase, the Ethereum price breached the key resistance trendline to resume a bullish recovery. On May 28th, the daily chart shows a decisive breakout from the downsloping trendline, with high volume indicating strong conviction from market buyers. Here’s how this breakout could influence the future trend of ETH prices.
Also Read: ETH To Rally To $2000, Dormant Ethereum Wallet Turns Active in 8 Years
Ethereum Price Daily Chart
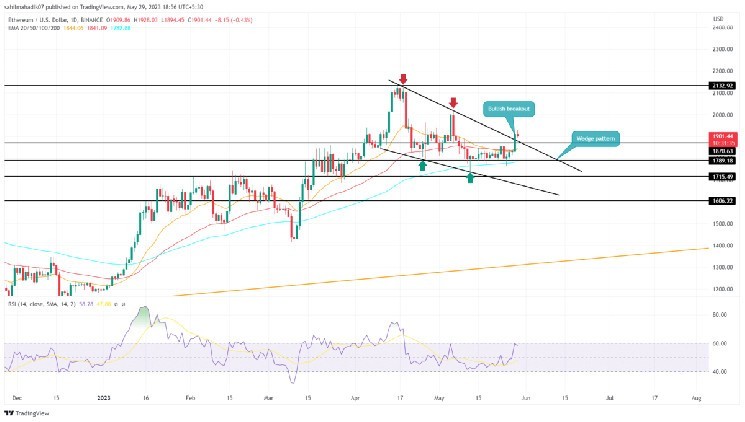
- Ethereum price breaks correction momentum with an upside breakout of the wedge pattern
- The ETH price above 100-and-200-day EMA reflects the overall trend remains bullish
- The intraday trading volume in Ether is $7.1 Billion, indicating a 71% gain.

Source- Tradingview
Amid the recent surge in buying activity, the ETH price breached the resistance trendline of a falling wedge pattern. This breakout is an early sign of trend reversal which triggered a significant upswing to higher chart levels.
As of now, the Ethereum price trades at $1899 mark with an intraday loss of 0.5%. This red candle printed could be the selling pressure arising from the profit booking of short-term traders. The coin price may retest the poked trendline as a potential support to check price sustainability.
If the buyers manage to hold the higher levels, the post-breakout rally could raise Ethereum’s market value 12.2% higher to hit $2132.
Will Ethereum Price Surpass $2000?
Completing the wedge pattern on a bullish note increases the underlying buying pressure in the Ethereum price. The breached trendline may act as a strong springboard for buyers to drive the price higher and potentially reach the $2132 mark. However, the coin holders must remain cautious about the in-between resistance of $2000.
- Directional Movement Index: A bullish crossover between D+(blue) and DI-(orange) slope reflects a positive trend in the market. Moreover, an uptick in the ADX slope projects the necessary strength to rise higher.
- Exponential Moving Average: A bullish crossover between the 20-and-100-day EMA increases the buying momentum in ETH.


 Bitcoin
  Ethereum
  Tether
  USDC
USDC  Dogecoin
  Cardano
  Bitcoin Cash
  Polygon
  Litecoin
  LEO Token
  Hedera
  Cosmos Hub
  Stellar
  OKB
OKB  Maker
Maker  Algorand
  NEO
NEO  Gate
Gate  KuCoin
  Synthetix Network
  IOTA
IOTA  Tether Gold
  TrueUSD
  0x Protocol
  Enjin Coin
  Ravencoin
  Siacoin
  Holo
Holo  Basic Attention
  Zcash
Zcash  Decred
  Lisk
Lisk  Ontology
  Waves
Waves  DigiByte
  Numeraire
  Nano
Nano  Status
  Pax Dollar
  Steem
Steem  OMG Network
  BUSD
BUSD  Ren
Ren  Bytom
Bytom  Bitcoin Diamond
  Augur
Augur  Energi
  HUSD
HUSD