


Ethereum Slips Below $1,300 as Bears Dominate Market Momentum (ETH Price Analysis)

Ethereum is not out of the woods despite closing last week’s candle in green. The mid-term uptrend is threatened by increasingly high selling pressure.
Technical Analysis
By Grizzly
The Daily Chart
The daily chart remains bearish. The diagonal support (in green) has so far kept the price from falling further but is now in danger of being broken.
Additionally, the 61.8% Fiib level (in yellow) is near this level of support. If the pair closes below $1,210 in a ETH could find itself in a dangerous situation where the selling pressure could increase and lead to a steeper decline. A move like this could result in a flood of stop losses, leading the price to potentially fall as low as $1,000 (in white).
Alternatively, the bearish sentiment will likely start getting invalidated if ETH can increase above $1,400 (in red). As lengthy upper wicks emerge on the chart, this level is strongly defended by sellers.
Key Support Levels: $1210 & $1000
Key Resistance Levels: $1400 & $1550
Daily Moving Averages:
MA20: $1322
MA50: $1462
MA100: $1506
MA200: $1879

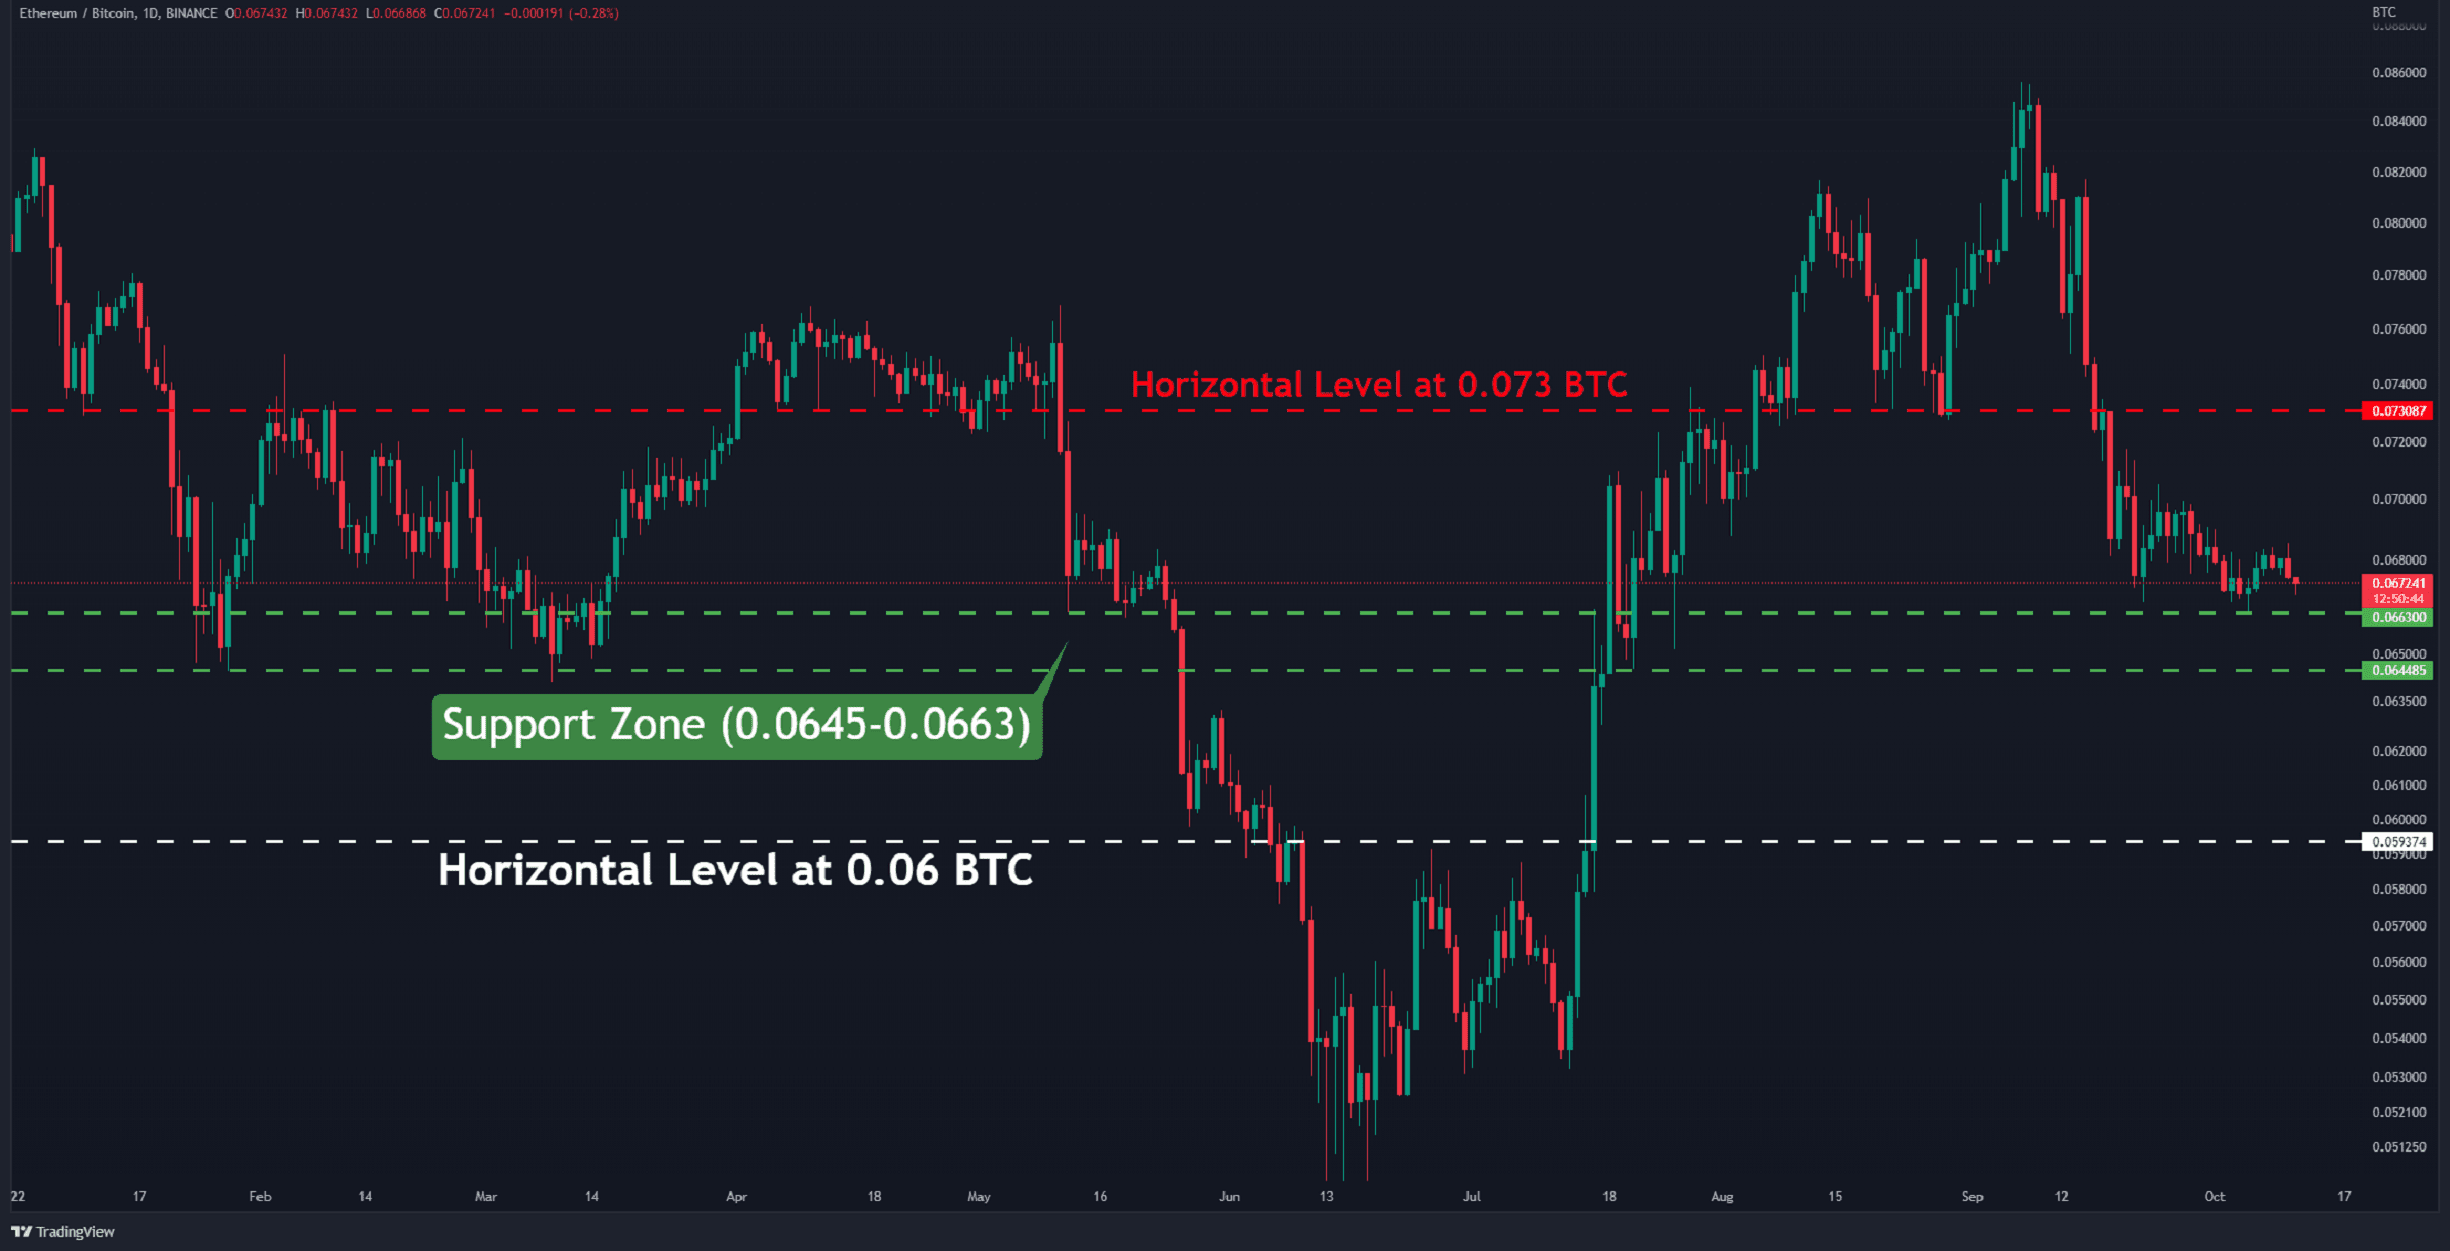
The ETH/BTC Chart
Against Bitcoin, the cryptocurrency is trading above the support zone between 0.0645 and 0.0663 BTC (in green). A break and close below it would pave the way for another leg down towards 0.06 BTC (in white).
This chart’s structure is entirely bearish, and there is no hint of a trend reversal. It appears there is no hope of a substantial upward rise as long as the price remains below the barrier of 0.073 BTC (in red).
Key Support Levels: 0.0645 & 0.06 BTC
Key Resistance Levels: 0.073 & 0.08 BTC


 Bitcoin
  Ethereum
  Tether
  USDC
USDC  Dogecoin
  Cardano
  Bitcoin Cash
  Polygon
  Litecoin
  LEO Token
  Hedera
  Cosmos Hub
  Stellar
  OKB
OKB  Maker
Maker  Algorand
  NEO
NEO  Gate
Gate  KuCoin
  Synthetix Network
  IOTA
IOTA  Tether Gold
  TrueUSD
  0x Protocol
  Enjin Coin
  Ravencoin
  Siacoin
  Holo
Holo  Basic Attention
  Zcash
Zcash  Decred
  Ontology
  Lisk
Lisk  Waves
Waves  DigiByte
  Numeraire
  Nano
Nano  Pax Dollar
  Status
  Steem
Steem  OMG Network
  BUSD
BUSD  Ren
Ren  Bytom
Bytom  Bitcoin Diamond
  Augur
Augur  Energi
  HUSD
HUSD