


ETH’s Recent Price Surge Is a Welcomed Change for Buyers

The largest altcoin by market cap and the second biggest crypto by market cap, Ethereum (ETH), has surged from its range lows to post an impressive 50% gain in just under a week.
The longer-term trend for ETH has been bearish going back to late November. However, the recent breakout in ETH’s price has seen bulls seize the initiative. The charts now show two areas where buyers can look to reload.
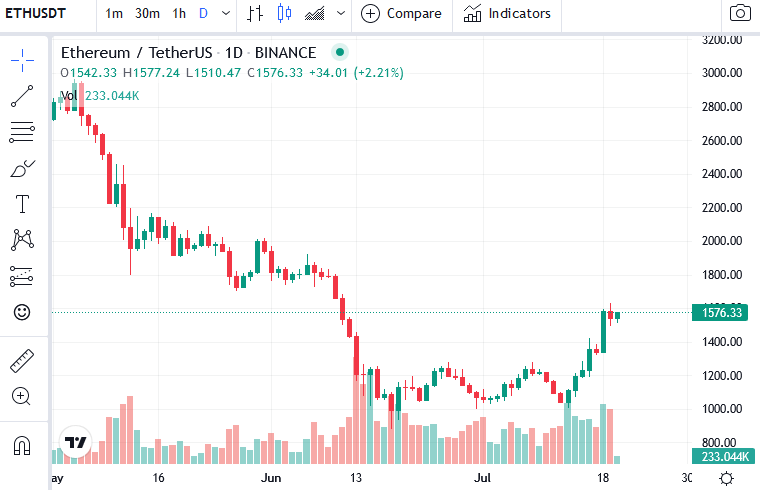
ETH daily chart (Source: CoinMarketCap)
On the daily chart, the most important thing to note is that the $1,750-$1,950 area represented stiff resistance. In July and March of last year, this zone was both a support and resistance. At the time of writing, it was once again a resistance barrier for ETH’s price.
Another thing that investors need to take note of is that there has been a steady downtrend in recent months, especially in April. In June, the price did form a range that ETH’s price has broken out of in the past few days.
The Relative Strength Index (RSI) also broke out of the neutral 50 to show that bulls had the upper hand. This has been a welcomed change for buyers, who had been caught in a downtrend since April.
The $1,750-$1,950 area could be tricky to navigate for both bulls and bears. However, the latest surge in ETH’s price may indicate that it will rise to the next target of $1,800 in the coming weeks.
At the time of writing, CoinMarketCap shows that ETH’s price experienced a 24-hour gain of 3.20% to take its price up to its current level at $1,573.46.
Disclaimer: The views and opinions expressed in this article are solely the author’s and do not necessarily reflect the views of CQ. No information in this article should be interpreted as investment advice. CQ encourages all users to do their own research before investing in cryptocurrencies.


 Bitcoin
  Ethereum
  Tether
  USDC
USDC  Dogecoin
  Cardano
  Bitcoin Cash
  Polygon
  Litecoin
  LEO Token
  Hedera
  Cosmos Hub
  Stellar
  OKB
OKB  Maker
Maker  Algorand
  NEO
NEO  Gate
Gate  KuCoin
  Synthetix Network
  IOTA
IOTA  Tether Gold
  TrueUSD
  Enjin Coin
  Holo
Holo  Ravencoin
  0x Protocol
  Siacoin
  Basic Attention
  Zcash
Zcash  Decred
  Ontology
  Lisk
Lisk  Waves
Waves  DigiByte
  Nano
Nano  Status
  Numeraire
  Pax Dollar
  Steem
Steem  OMG Network
  BUSD
BUSD  Ren
Ren  Bitcoin Diamond
  Bytom
Bytom  HUSD
HUSD  Energi
  Augur
Augur