


Glassnode: What Bitcoin Long-Term Holder Cost Basis Tells Us About Bear Market Length

Data from Glassnode shows the Bitcoin long-term holder cost basis is currently above the realized price of the crypto.
Bitcoin Long-Term Holder Cost Basis May Have Hints For Bear Market Length
As per the latest weekly report from the analytics firm Glassnode, the LTH cost basis has remained below the realized price for a period of between 248 to 575 days in previous bear markets.
Bitcoin “long-term holders” (or LTHs in short) include all investors who have been holding onto their coins since at least 155 days without moving or selling them.
The realized cap of the market is calculated by multiplying each coin in circulation with the price it was last moved/sold at and then taking a sum.
Related Reading | Crypto Market Observes $150m Liquidations As Bitcoin Slips Under $22k
From this capitalization, a “realized price” can be derived by simply dividing this metric with the total number of coins in circulation.
The realized price can be thought of as the cost basis of the average holder in the Bitcoin market. The below chart shows how the cost basis for LTHs has compared against that of the whole market during the history of the crypto.
Looks like the LTH cost basis has recently crossed above the realized price | Source: Glassnode’s The Week Onchain — Week 30, 2022
As you can see in the above graph, the previous Bitcoin bear markets and the trends of the two realized prices during them are highlighted.
It seems like the LTH cost basis has always crossed above the entire market’s realized price as the crypto has approached bear lows.
Related Reading | Cryptocurrencies That Will Attain Widespread Integration: Mehracki (MKI), Bitcoin (BTC), Near Protocol (NEAR)
This happens because LTHs are the cohort least likely to sell at any point, while the rest of the market panic sells easier during downtrends. LTHs try to weather the storm even after going underwater, but other holders dump, thus lowering the average realized price.
From the chart, it’s apparent that the LTH price basis has remained above the realized price for at least 248 days and upto 575 days during the last bear markets.
Recently, the pattern of the LTH price basis crossing above the other metric has once again formed. But so far, the indicators have only observed this trend for 17 days, much lesser than historical cycles.
BTC Price
At the time of writing, Bitcoin’s price floats around $20.7k, down 9% in the past week. Over the last month, the crypto has lost 3% in value.
The below chart shows the trend in the price of the coin over the last five days.
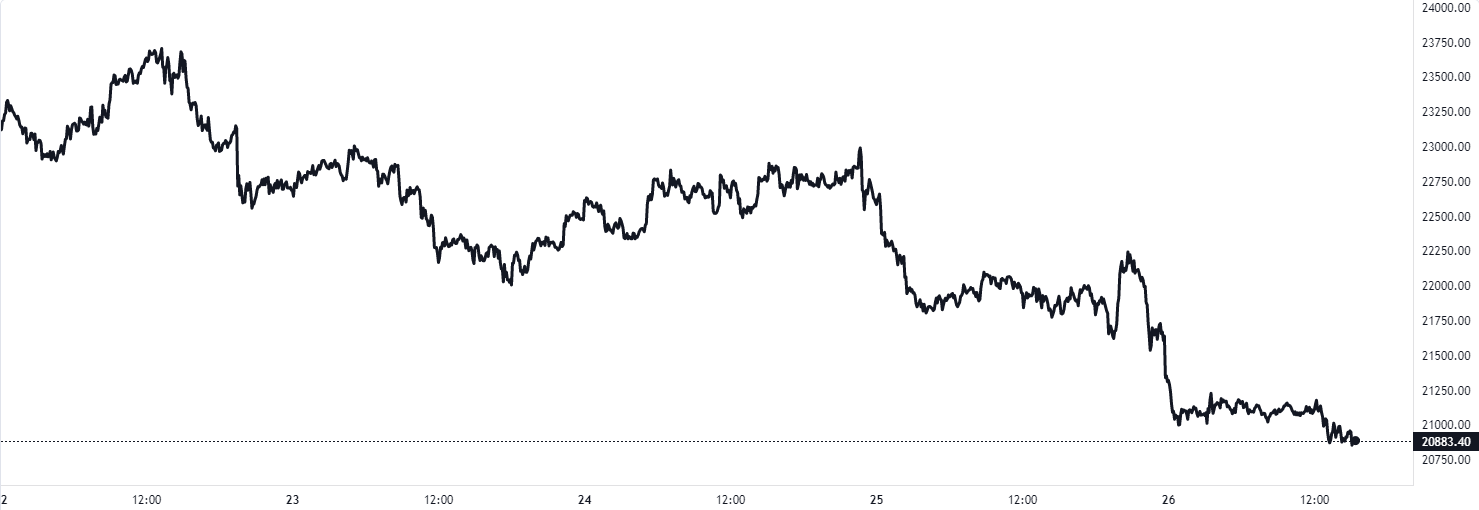
The value of the crypto seems to have slid down during the last few days | Source: BTCUSD on TradingView
Featured image from Hans-Jurgen Mager on Unsplash.com, charts from TradingView.com, Glassnode.com


 Bitcoin
  Ethereum
  Tether
  USDC
USDC  Dogecoin
  Cardano
  Bitcoin Cash
  Polygon
  Litecoin
  LEO Token
  Hedera
  Stellar
  Cosmos Hub
  OKB
OKB  Maker
Maker  Algorand
  NEO
NEO  Gate
Gate  KuCoin
  Synthetix Network
  IOTA
IOTA  Tether Gold
  TrueUSD
  Enjin Coin
  Holo
Holo  Ravencoin
  0x Protocol
  Siacoin
  Basic Attention
  Zcash
Zcash  Decred
  Ontology
  Lisk
Lisk  Waves
Waves  DigiByte
  Numeraire
  Status
  Nano
Nano  Pax Dollar
  Steem
Steem  OMG Network
  BUSD
BUSD  Ren
Ren  Bytom
Bytom  Bitcoin Diamond
  HUSD
HUSD  Energi
  Augur
Augur