


Has Bitcoin’s Price Hit Its Bottom as CPI Levels Off Slightly?
Recent data from the US Bureau of Labor and Statistics shows that the Consumer Price Index (CPI) has remained relatively consistent over the last 2 months.
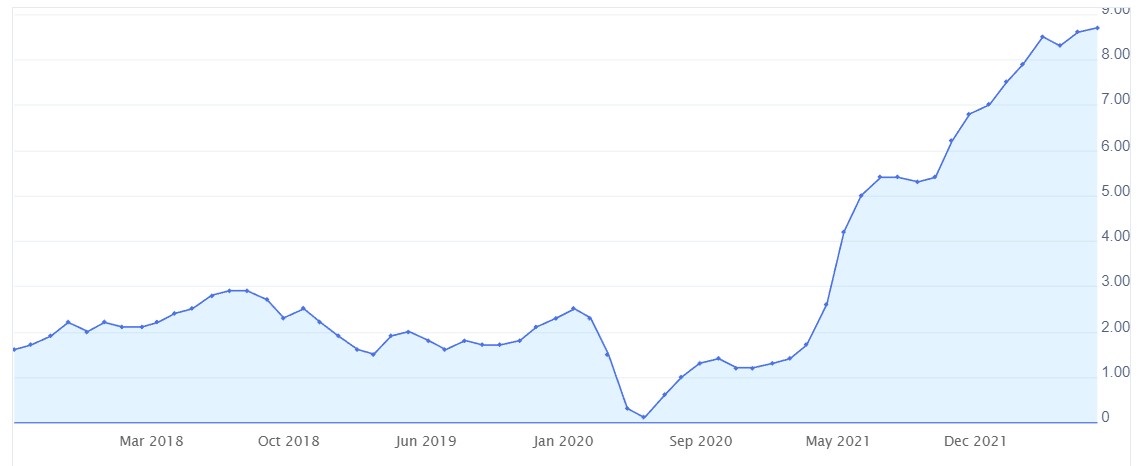
CPI line chart (Source: Investing.com)
As seen from the line chart above, the US CPI has leveled off somewhat over the last two months after being on an extreme positive slope since June 2020. In this period, the CPI has risen from 0.1 to 8.7. In the last two months, the CPI has only increased by 0.1. With this being the case, is Bitcoin (BTC) finally establishing its bottom as inflation may be leveling off?
Recently, BTC has broken above the $20,000 level according to CoinMarketCap. Its price now stands at around $20,107.97.
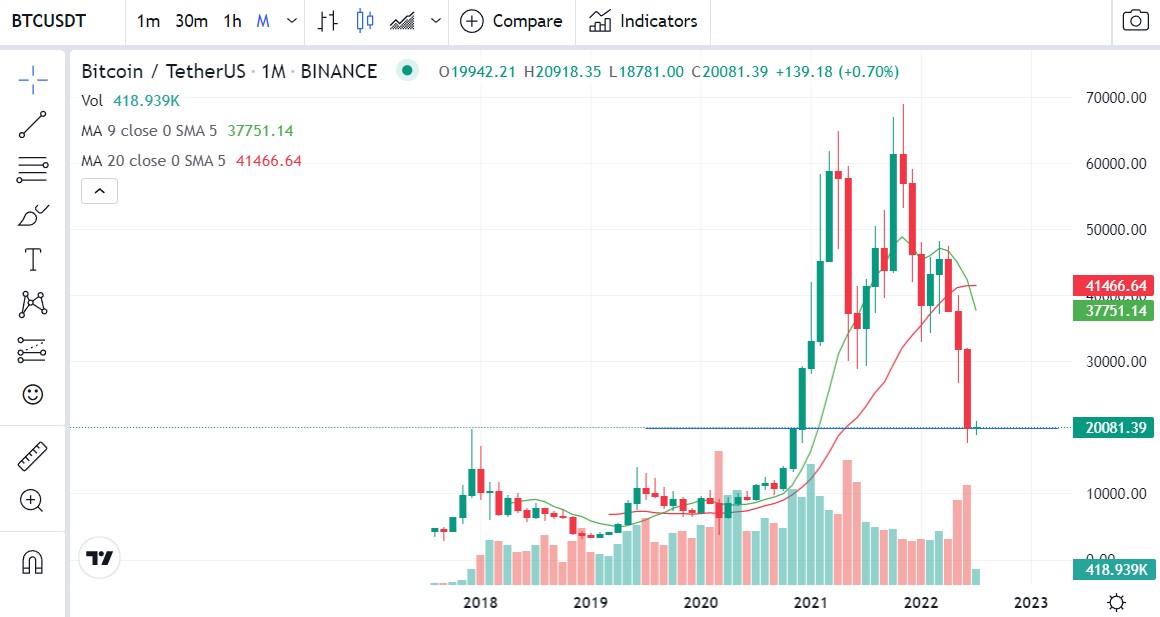
BTC monthly chart (Source: CoinMarketCap)
Looking at the daily chart for BTC, the price of BTC has reached a major level on the monthly chart around the $20,000 level. This is after the price of BTC closed the previous months in losses as the CPI continued to rise throughout these months.
As a result of the continued price fall, the 9 Moving Average (MA) has crossed below the 20 Moving Average (MA) for the first time in BTC’s history. This is a bearish flag that suggests that BTC’s price may continue to fall.
With this being the case, the $20,000 level may not be able to hold off the selling pressure seen on the monthly chart for much longer. It would be fair to say that the BTC has established its bottom if the 9 MA and 20 MA lines were positioned differently, with the 9 MA positioned above the 20 MA.
Disclaimer: The views and opinions expressed in this article are solely the author’s and do not necessarily reflect the views of CQ. No information in this article should be interpreted as investment advice. CQ encourages all users to do their own research before investing in cryptocurrencies.


 Bitcoin
  Ethereum
  Tether
  USDC
USDC  Dogecoin
  Cardano
  Bitcoin Cash
  Polygon
  Litecoin
  LEO Token
  Hedera
  Stellar
  Cosmos Hub
  OKB
OKB  Maker
Maker  Algorand
  NEO
NEO  Gate
Gate  KuCoin
  Synthetix Network
  IOTA
IOTA  Tether Gold
  TrueUSD
  Enjin Coin
  Holo
Holo  Ravencoin
  0x Protocol
  Siacoin
  Basic Attention
  Decred
  Zcash
Zcash  Ontology
  Lisk
Lisk  Waves
Waves  DigiByte
  Numeraire
  Status
  Nano
Nano  Pax Dollar
  Steem
Steem  OMG Network
  BUSD
BUSD  Ren
Ren  Bytom
Bytom  Bitcoin Diamond
  HUSD
HUSD  Energi
  Augur
Augur