Quant Analyst PlanB Says Bitcoin Price Action Mirrors Pattern That Preceded Epic Rally to $69,000

Popular quantitative analyst PlanB says Bitcoin’s (BTC) current price action mirrors a pattern that preceded the massive rally that catapulted BTC to its all-time high.
The pseudonymous trader argues to his 1.8 million Twitter followers that $20,000 “is the new” $4,000 for BTC.
After breaking $19,000 in late 2017, Bitcoin plummeted to below $4,000 by late 2018. BTC hovered around that $4,000 level until April 2019, when it started moving upwards. The top crypto asset by market cap then largely continued its ascent until November 2021 when it printed its all-time high of $69,000.
$20K is the new $4K pic.twitter.com/HCnIla45KA
— PlanB (@100trillionUSD) October 16, 2022
Bitcoin is trading at $19,606 at time of writing and is up 1.7% in the past 24 hours. BTC has been trading around the $20,000 level since mid-June.
PlanB also notes that the percentage of Bitcoin in loss currently mirrors the levels it was at during great buying opportunities in 2011, 2015 and 2019.
Great buying opportunity (like 2011, 2015 and 2019) or this time is different, that is the question. pic.twitter.com/Wh1Pp44xgR
— PlanB (@100trillionUSD) October 13, 2022
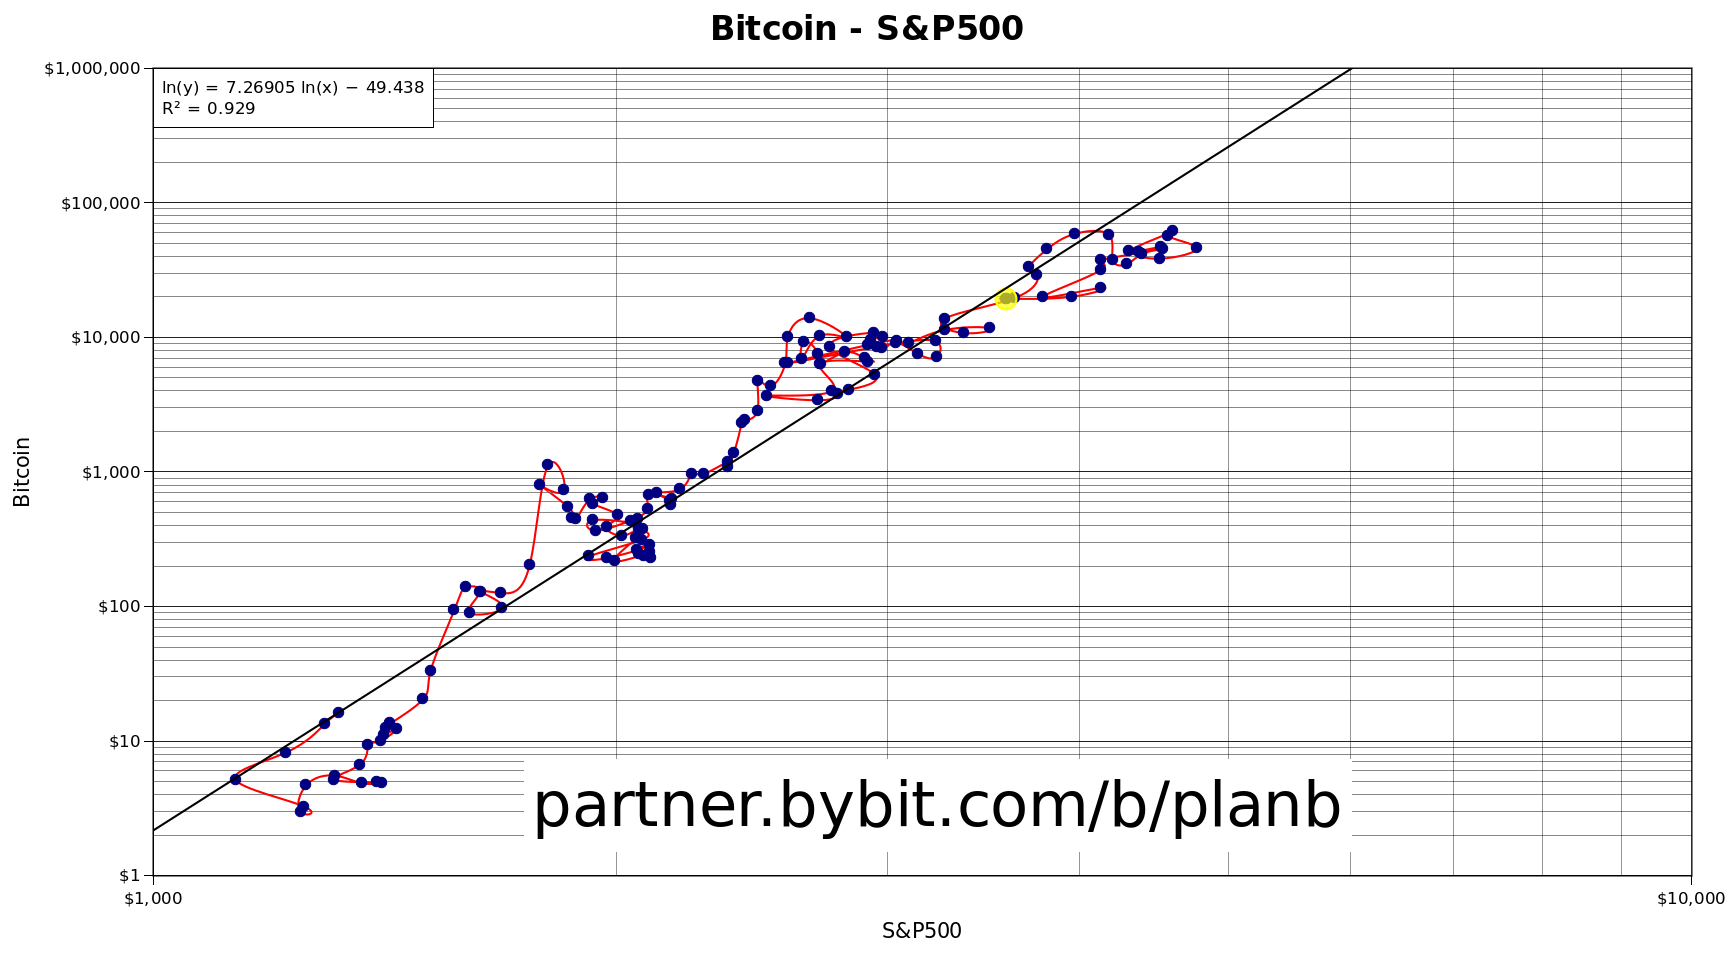
Looking at the correlation between Bitcoin and the S&P 500, the analyst predicts that both BTC and the stock market index will eventually recover from the current bear market.
“It’s only recently that people started complaining about the correlation between Bitcoin and S&P500, only since they both decreased in value. But the correlation has always been there since S&P500 increased from 1,000 [points] to 4,000 [points] and BTC from $1 to $20,000. Both will rise again.”

Source: 100trillionUSD/Twitter
PlanB also notes that most of the Bitcoin selling in the past 12 months came from traders who are cutting their losses after buying BTC at $60,000, as well as some older buyers who are taking profits after accumulating BTC for less than $15,000.
Featured Image: Shutterstock/Xavier Fargas


 Bitcoin
  Ethereum
  Tether
  USDC
USDC  TRON
TRON  Dogecoin
  Cardano
  Monero
  Bitcoin Cash
  Chainlink
  LEO Token
  Stellar
  Zcash
Zcash  Litecoin
  Hedera
  Dai
Dai  Cronos
  OKB
OKB  Tether Gold
  Ethereum Classic
  KuCoin
  Cosmos Hub
  Gate
Gate  Algorand
  VeChain
  Dash
Dash  Stacks
  Tezos
Tezos  TrueUSD
  IOTA
IOTA  Decred
  Theta Network
  Basic Attention
  NEO
NEO  Synthetix
  Qtum
Qtum  Ravencoin
  0x Protocol
  DigiByte
  Zilliqa
  Nano
Nano  Siacoin
  Numeraire
  Waves
Waves  Ontology
  Status
  Enjin Coin
  Hive
Hive  BUSD
BUSD  Pax Dollar
  Lisk
Lisk  Steem
Steem  Huobi
Huobi  OMG Network
  Bitcoin Gold
  NEM
NEM  Augur
Augur  Bitcoin Diamond