


Two Technical Bitcoin Indicators Diverge; Each Has Value Depending on Investors’ Timelines

An often-used measure of value in technical analysis and a more recent valuation metric specific to on-chain analysis are at odds at the moment. Each is relevant, depending on how fast an investor is looking to generate gains.
The more recent, bitcoin’s MVRV (market-value-to-realized-value) ratio, measures the ratio of BTC’s market capitalization to its realized capitalization. It implies BTC is trading cheaply on a relative basis and foreshadows likely future trends.
MVRV readings above 3.7 indicate that an asset is overvalued, while readings below 1 indicate that an asset is undervalued.
With a current reading of 0.85, bitcoin’s MVRV ratio has fallen to levels last seen in 2019, implying that current prices present a compelling entry point for long biased investors. For context, BTC prices were trading sub $5,000 during that time period.
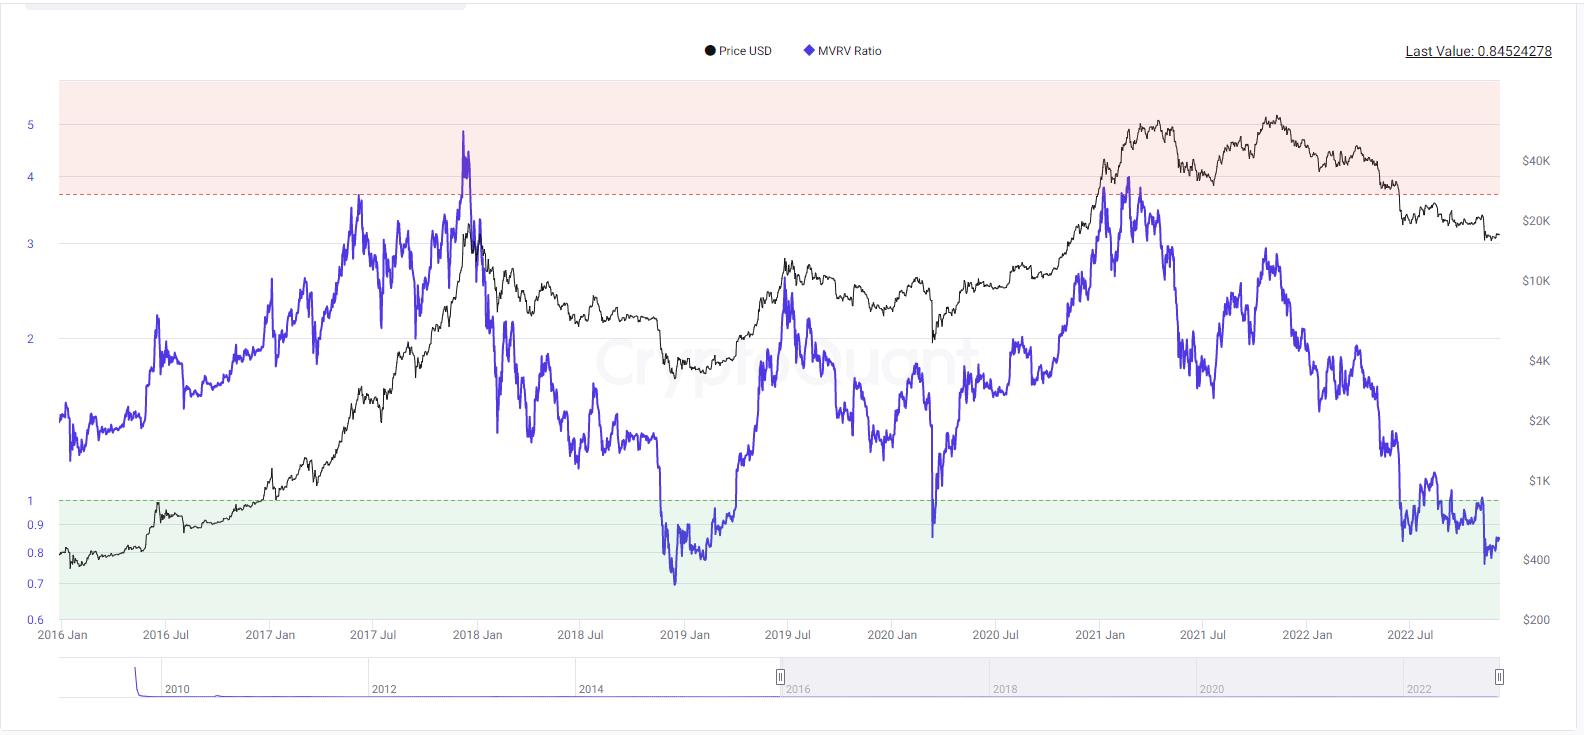
Bitcoin’s MVRV ratio 12/6/22 (CryptoQuant)
Bitcoin’s current relative strength index (RSI), however, implies that BTC’s price is fairly valued, given its current reading of 48. RSI ranges from 0-100, with readings above 70 implying that prices are overvalued and those below 30 indicating the opposite. RSI’s reflect likely, immediate price movement.
Despite the neutral reading, a look at historical pricing when BTC’s RSI trades at or around 48 shows a hint of promise. In over 120 occurrences since 2015, following a reading between 47 and 49,BTC has increased on average 6% after 90 days and 2% after seven days.
A look at BTC’s Bollinger Bands shows a series of six consecutive narrow-range trading days, with prices briefly touching the upper range of its bands and now trending in the direction of the 20-day moving average.
The narrow trading range implies a lack of conviction among traders. The reversion to the 20-day average suggests that BTC is trading relatively close to where it should be.
To be sure, the discrepancy between the indicators is small.
MVRV holds primary relevance for investors, who tend to look longer term for payoffs. RSI and Bollinger Bands are most relevant for traders, who seek to accumulate gains more quickly.
Ultimately, the MVRV ratio appears to be a valid indication of BTC’s current intrinsic value. Technical indicators such as the RSI and Bollinger Band indicate the length of time in which BTC will remain undervalued.
Investors who are long bitcoin have an opportunity to acquire bitcoin as it trades near three-year lows relative to its realized value, but only if they can tolerate current price levels, which are unlikely to move much for the foreseeable future.


 Bitcoin
  Ethereum
  Tether
  USDC
USDC  Dogecoin
  Cardano
  Bitcoin Cash
  Polygon
  Litecoin
  LEO Token
  Hedera
  Cosmos Hub
  Stellar
  OKB
OKB  Maker
Maker  Algorand
  NEO
NEO  Gate
Gate  KuCoin
  Synthetix Network
  IOTA
IOTA  Tether Gold
  TrueUSD
  Enjin Coin
  Holo
Holo  Ravencoin
  0x Protocol
  Siacoin
  Basic Attention
  Zcash
Zcash  Decred
  Ontology
  Lisk
Lisk  Waves
Waves  DigiByte
  Nano
Nano  Numeraire
  Status
  Pax Dollar
  Steem
Steem  OMG Network
  BUSD
BUSD  Ren
Ren  Bitcoin Diamond
  Bytom
Bytom  HUSD
HUSD  Energi
  Augur
Augur