CHZ, ALGO, LDO, ETHW and NEAR Lead Crypto Market Rout

BeInCrypto takes a look at five projects that decreased the most from the entire crypto market last week, more specifically, from Nov. 18 to Nov. 25
These digital assets have taken the crypto news and crypto market spotlight:
- Chiliz (CHZ) price is down 28.28%
- Algorand (ALGO) price is down 12.66%
- Lido DAO (LDO) price is down 12.22%
- EthereumPoW (ETHW) price is down 11.32%
- Near Protocol (NEAR) price is down 11.29%
CHZ Leads Crypto Market Drop
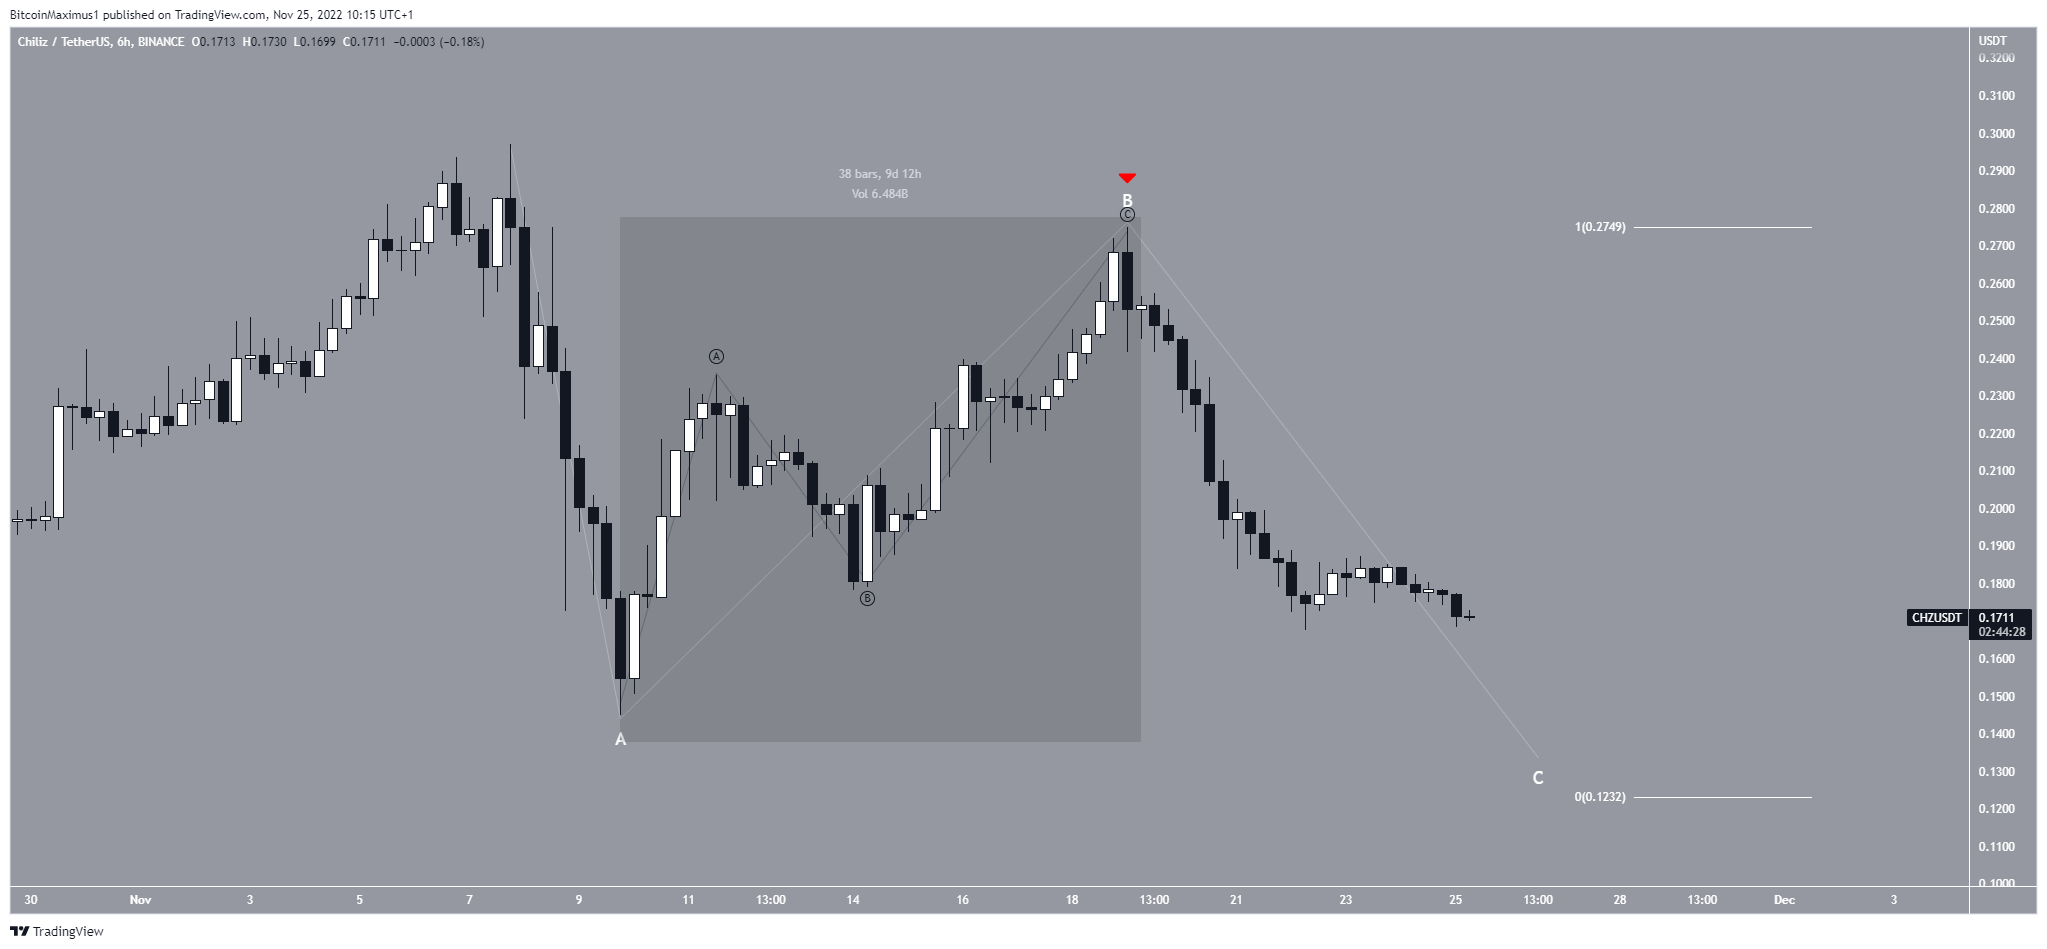
The CHZ price has fallen since Nov. 7. On Nov. 19, it created a slightly lower high (red icon) and resumed its downward movement.
The movement Nov. 9 – 19 (highlighted) resembles an A-B-C corrective structure (black). Therefore, the decrease from Nov. 7 may also be an A-B-C correction (white). In this possibility, the CHZ price is in wave C of this correction.
Giving waves A:C a 1:1 ratio (white) would lead to a low of $0.123. Afterward, an upward movement would be likely.

CHZ/USDT Chart By TradingView
ALGO Falls Below Crucial Horizontal Area
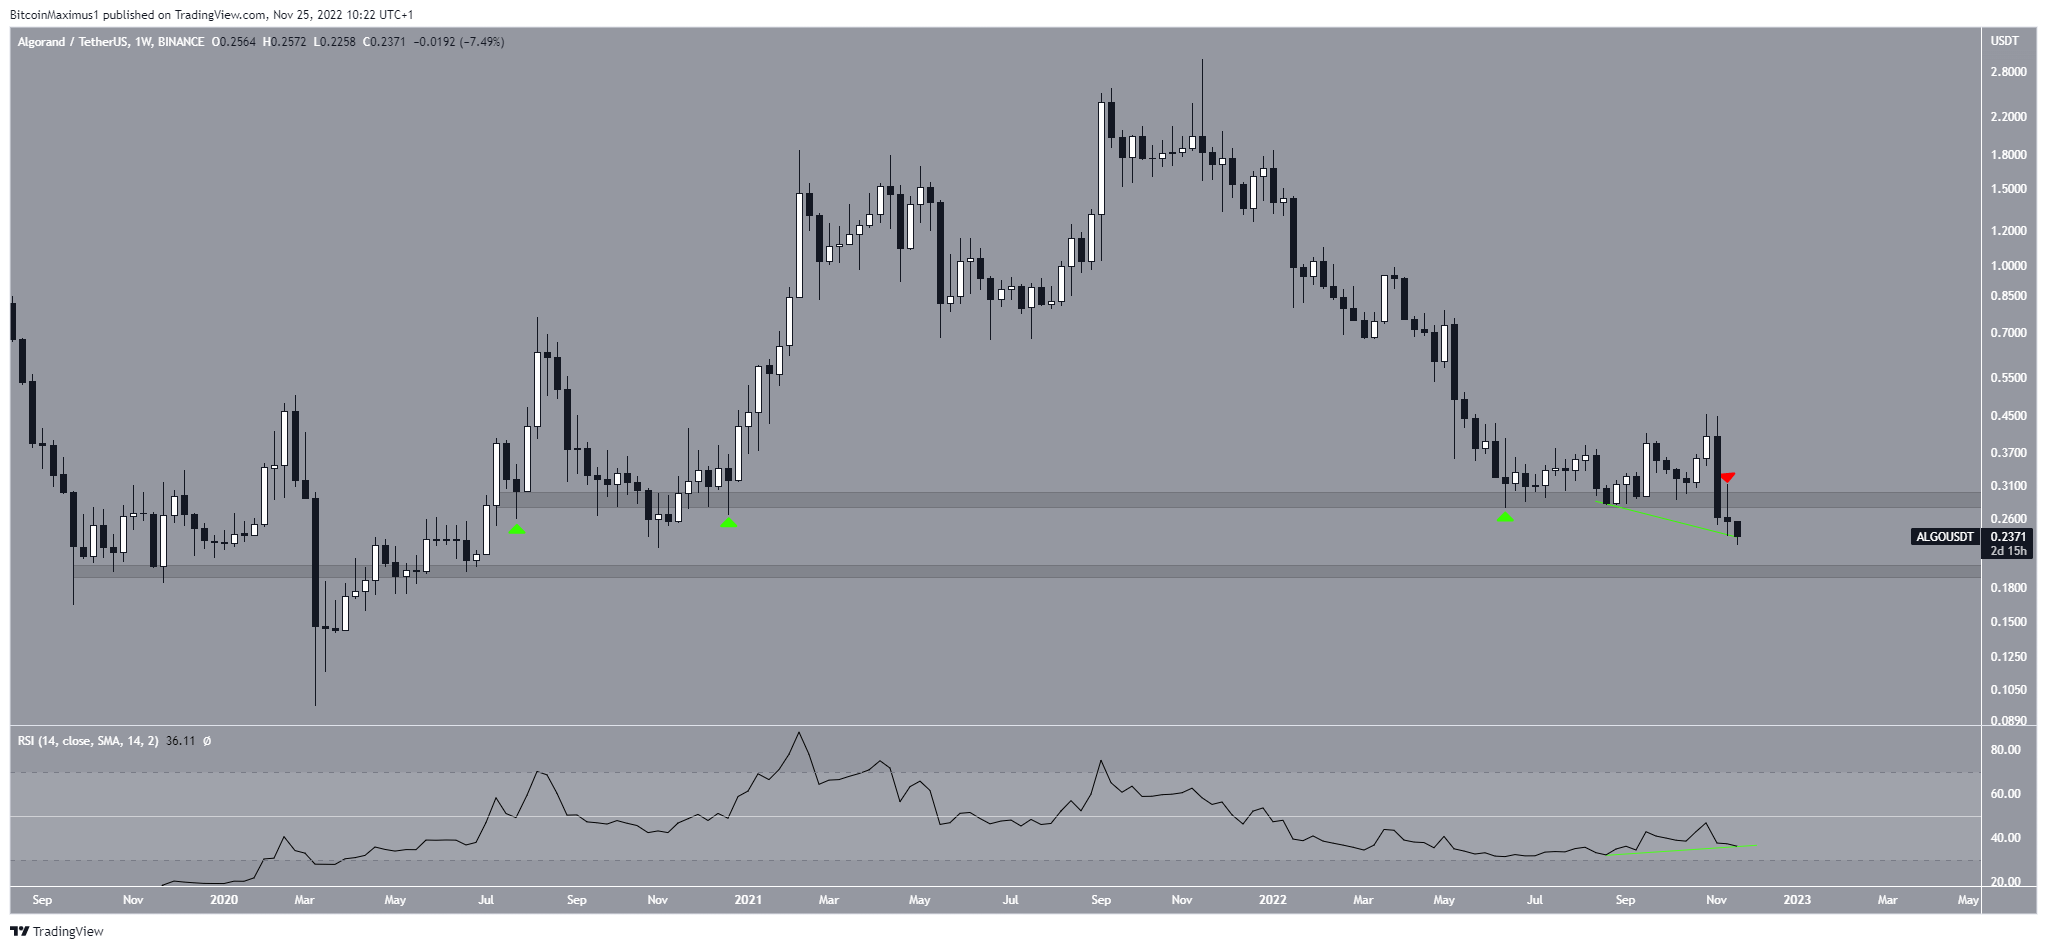
The ALGO price had been trading above the $0.29 horizontal support area since the beginning of 2021. However, it finally broke down on Nov. 9. The breakdown and ensuing downward movement led to a low of $0.22. The next closest support area is at $0.20.
While the weekly RSI has generated bullish divergence (green line), the trend is considered bearish until the ALGO price reclaims the $0.29 resistance area. If it is not successful in doing so, a drop towards $0.20 is the most likely scenario.

ALGO/USDT Chart By TradingView
LDO Re-Tests Previous Resistance
On Oct. 17, the LDO price broke out from a descending resistance line that had been in place since Aug. 14. While it decreased afterward, the downward movement validated the resistance line as support (green circle).
Now, the LDO price is trading in a short-term range between $0.93 and $1.29. Whether the price breaks out above the latter or breaks down below the former will likely determine the direction of the future trend.

LDO/USDT Chart By TradingView
ETHW Generates Bullish Divergence
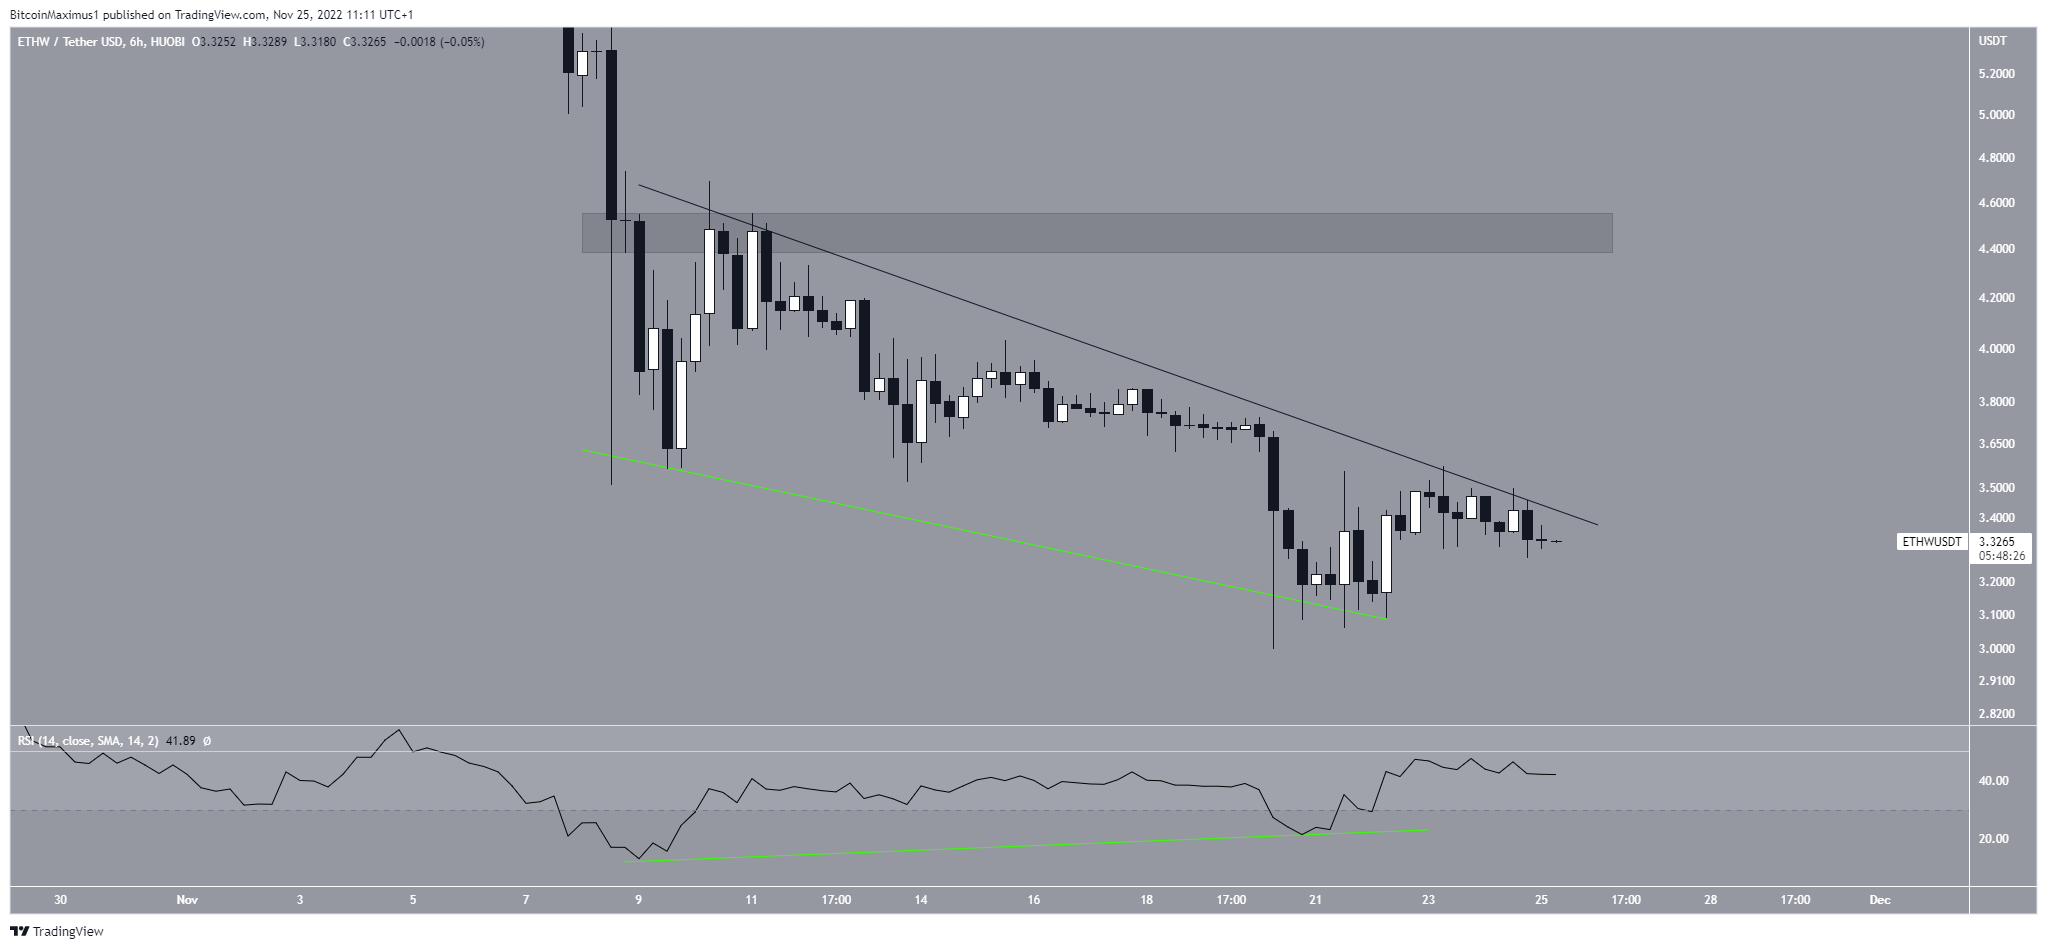
The ETHW price had fallen below a descending resistance line since Nov. 8. The downward movement led to a low of $3 on Nov. 20.
Afterward, the price began a bounce which was preceded by bullish divergence (green line) in the RSI. Currently, ETHW is making another attempt at breaking out from the line.
Since lines get weaker each time they are touched, a breakout from it is expected. If one occurs, the next closest resistance area would be at $4.50.
Conversely, decreasing below the $3 lows would invalidate this bullish prediction.

ETHW/USDT Chart By TradingView
NEAR Could Begin Rally Soon
NEAR had decreased below a descending resistance line since Nov. 10. This downward movement led to a low of $1.43 on Nov. 21.
Afterward, the RSI generated bullish divergence (green line) and catalyzed an upward movement. On Nov. 23, the price broke out from the descending resistance line. It is currently in the process of validating it as support.
If successful, this could initiate an upward movement towards $2.20.
On the other hand, a decrease below the descending resistance line would invalidate this bullish price forecast.

NEAR/USDT Chart By TradingView
Disclaimer: BeInCrypto strives to provide accurate and up-to-date news and information, but it will not be responsible for any missing facts or inaccurate information. You comply and understand that you should use any of this information at your own risk. Cryptocurrencies are highly volatile financial assets, so research and make your own financial decisions.


 Bitcoin
  Ethereum
  Tether
  USDC
USDC  TRON
TRON  Dogecoin
  Cardano
  Bitcoin Cash
  Chainlink
  Monero
  LEO Token
  Zcash
Zcash  Stellar
  Litecoin
  Hedera
  Dai
Dai  Cronos
  Tether Gold
  OKB
OKB  Ethereum Classic
  KuCoin
  Gate
Gate  Algorand
  Cosmos Hub
  VeChain
  Tezos
Tezos  TrueUSD
  Dash
Dash  Stacks
  IOTA
IOTA  Decred
  Basic Attention
  Theta Network
  NEO
NEO  Synthetix
  Qtum
Qtum  Ravencoin
  DigiByte
  0x Protocol
  Nano
Nano  Zilliqa
  Holo
Holo  Siacoin
  Numeraire
  Waves
Waves  BUSD
BUSD  Status
  Enjin Coin
  Pax Dollar
  Ontology
  Lisk
Lisk  Hive
Hive  Steem
Steem  Huobi
Huobi  OMG Network
  NEM
NEM  Bitcoin Gold
  Augur
Augur  HUSD
HUSD