


S&P 500 Pierces Resistance: What Does It Mean for Bitcoin (BTC)?
The S&P 500 Index (SPX) broke through long-term resistance today and reached its highest level in more than a year.
If a positive correlation with the Bitcoin price is recovered, this could signal a resumption of the uptrend in the cryptocurrency market.
What Is the S&P 500?
The Standard and Poor’s 500, or simply the S&P 500 (SPX), is a stock market index that tracks the performance of the 500 largest companies listed on stock exchanges in the United States. It is one of the most widely tracked stock market indexes.
The S&P 500 index is a market capitalization-weighted index. According to Wikipedia, as of August 31, 2022, the nine largest companies on the S&P 500 list accounted for 27.8% of the index’s market capitalization.
In order from highest to lowest weighting, they were: Apple, Microsoft, Alphabet, Amazon.com, Tesla, Berkshire Hathaway, UnitedHealth Group, Johnson & Johnson, and ExxonMobil.
The SPX listing dates back to the 1950s. Since then, the index has been in a long-term uptrend and is a market reflection of the health of the US economy.
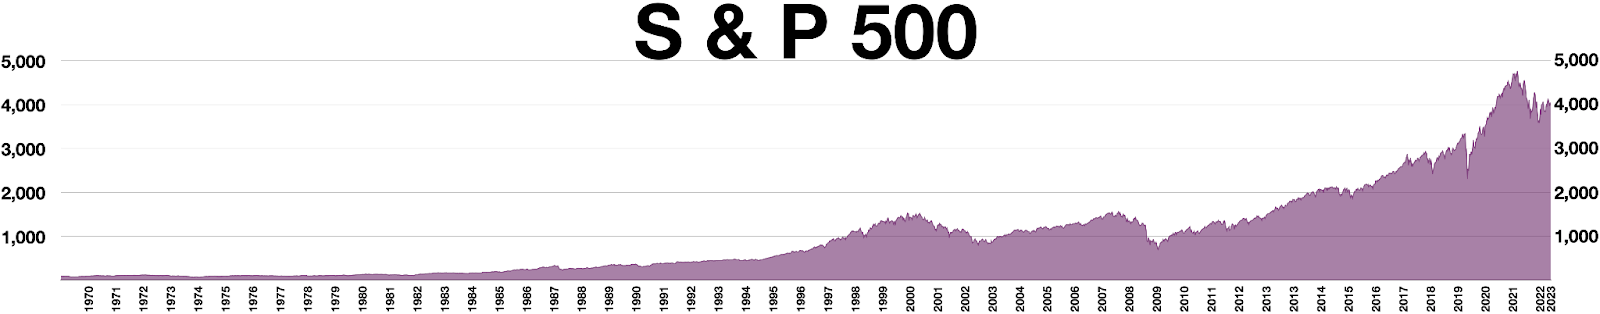
S&P 500 long-term chart. Source: Wikipedia
SPX Reaches New Yearly High
The SPX had been in a downtrend since reaching the all-time high (ATH) of $4818 on January 4, 2022. Thereafter, almost the entire year was a bear market, which ended with a bottom at $3492 on October 11, 2022. The price followed the descending resistance line (black).
Since then, SPX has initiated an uptrend and has risen 24% to today’s valuation at $4338. At the beginning of 2023, the descending resistance line was broken through and subsequently validated as support (orange circles).
At the same time, the SPX price struggled with resistance in the $4200 area (green line). This important area has repeatedly acted as support and resistance. If a correction occurs, a bullish re-test of this level is expected.
Besides, today the SPX broke through another important resistance at $4325, which was the high reached in August 2022. If the increase does not turn out to be just a deviation, and the uptrend is maintained, the next resistance level is at $4635. This will be the last stop before the ATH at $4818.
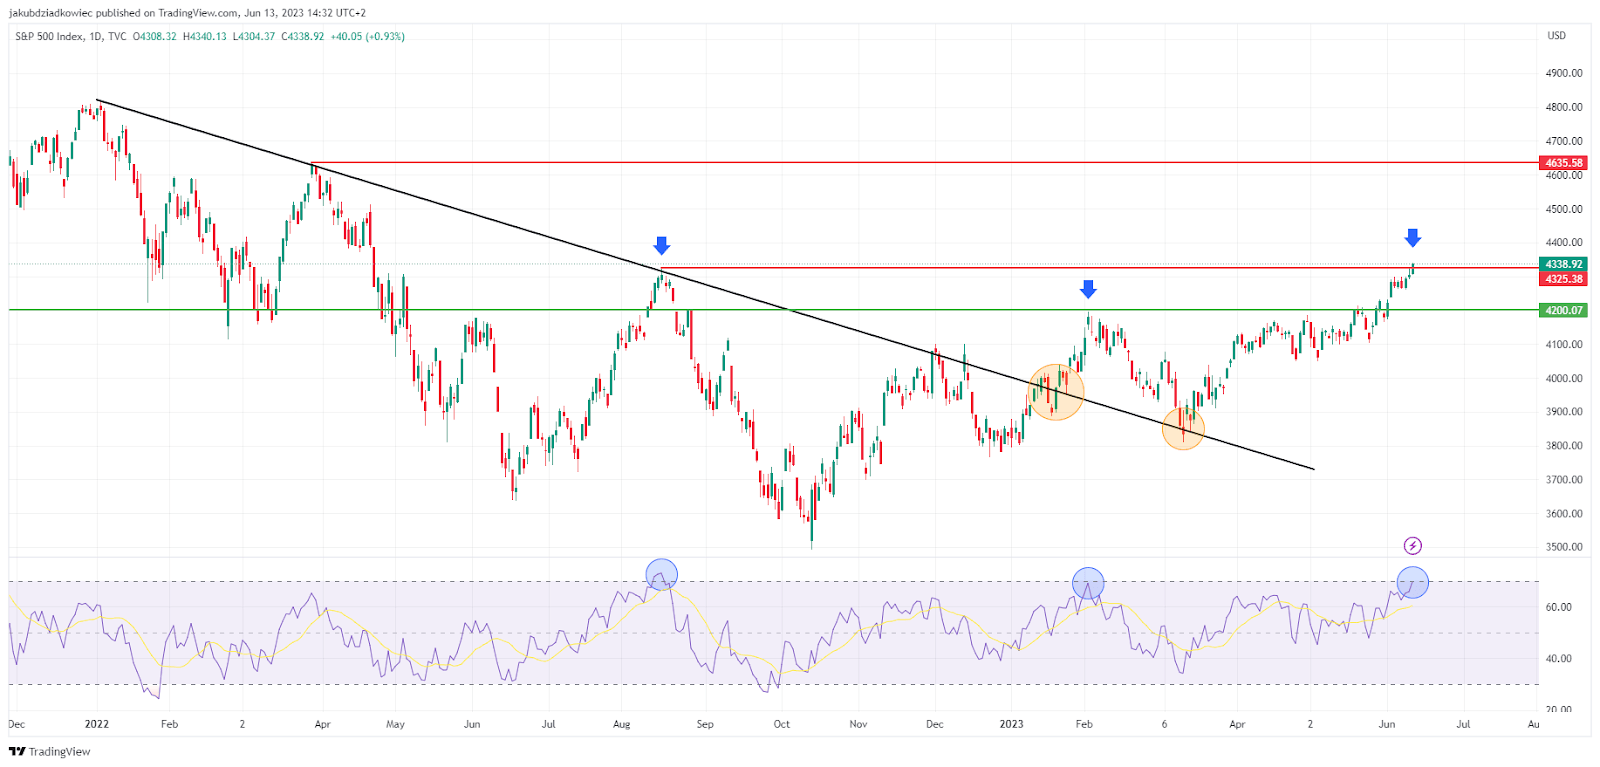
SPX chart by Tradingview
It is worth mentioning that despite the strong increase, the Relative Strength Index (RSI) has not yet entered the overbought territory. However, in favor of the bears is the fact that for the past 1.5 years. Whenever the RSI reached the 70 area, the price would record a local peak and drop (blue areas).
One analyst on Twitter, @MisterSpread suggested that even if the SPX price now fell to the $4200 area. It would still be a bullish signal. In his view, the S&P 500 may be entering a “mania phase, when markets can stay irrational longer than people can stay liquid.”
Does Correlation With BTC Indicate a Bounce in the CryptoMarket?
The long-term correlation of the S&P 500 index with Bitcoin remains mostly positive. This applies to both downward and upward trends. For example, the correlation of the two assets remained positive throughout almost the entire 2022 bear market.
Only at the end of the year did the correlation become negative. At that time, the SPX was already in an accumulation phase, and BTC was still hitting a macro bottom due to the FTX crash and its aftermath in November 2022. However, the SPX increase and negative correlation with BTC at the time could have served as an early signal of a bullish trend reversal.
A similar situation occurred in February/March 2023. The correlation turned negative for a brief period. This came as Bitcoin’s correction proved much more severe than the mostly sideways trend of the S&P 500.
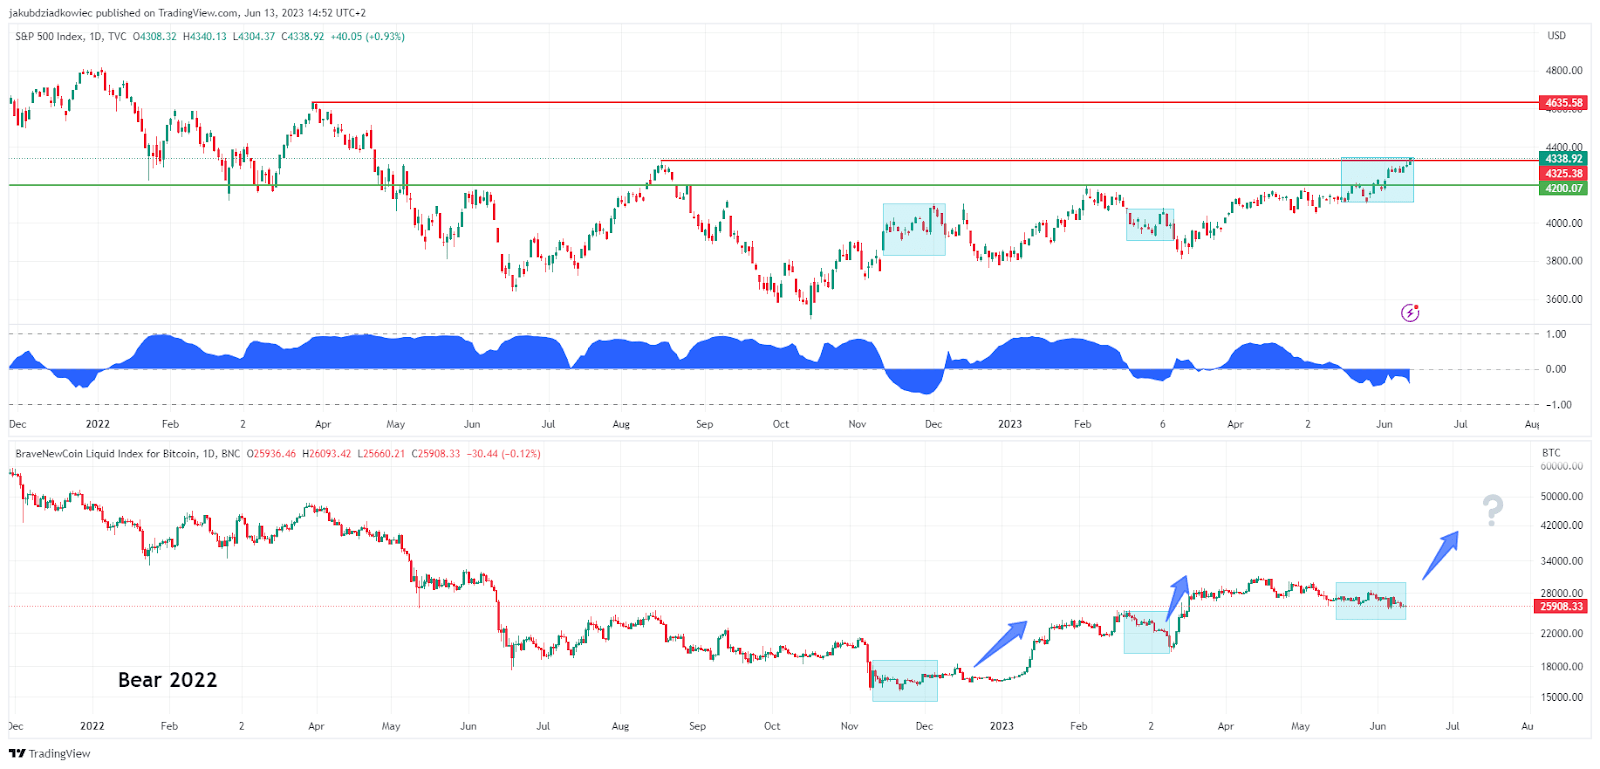
SPX and BTC correlation by Tradingview
Finally, we are currently seeing a negative correlation again since mid-May. SPX is increasing and breaking through an important resistance level. At the same time, BTC is stuck in a sideways and slightly downward momentum. If the situation plays out similarly to the previous two cases, the cryptocurrency market can be expected to follow traditional assets’ footsteps.
This could lead Bitcoin to retest and perhaps even break through the resistance at the $31,000 level. However, if the positive correlation is regained by the joint decline of both markets, the nearest support for the BTC price will be the 200-day moving average at $23,600.


 Bitcoin
  Ethereum
  Tether
  USDC
USDC  Dogecoin
  Cardano
  Bitcoin Cash
  Polygon
  Litecoin
  LEO Token
  Hedera
  Stellar
  Cosmos Hub
  OKB
OKB  Maker
Maker  Algorand
  NEO
NEO  Gate
Gate  KuCoin
  Synthetix Network
  IOTA
IOTA  Tether Gold
  TrueUSD
  Enjin Coin
  Ravencoin
  Holo
Holo  0x Protocol
  Siacoin
  Basic Attention
  Zcash
Zcash  Ontology
  Decred
  Waves
Waves  Lisk
Lisk  DigiByte
  Status
  Numeraire
  Nano
Nano  Pax Dollar
  Steem
Steem  OMG Network
  BUSD
BUSD  Ren
Ren  Bytom
Bytom  Bitcoin Diamond
  HUSD
HUSD  Energi
  Augur
Augur