Chainlink Reaches The Low At $7.28 Before Moving Sideways Again

The price of Chainlink (LINK), which has risen to a high of $7.80, is in an uptrend.
Chainlink price long-term analysis: bullish
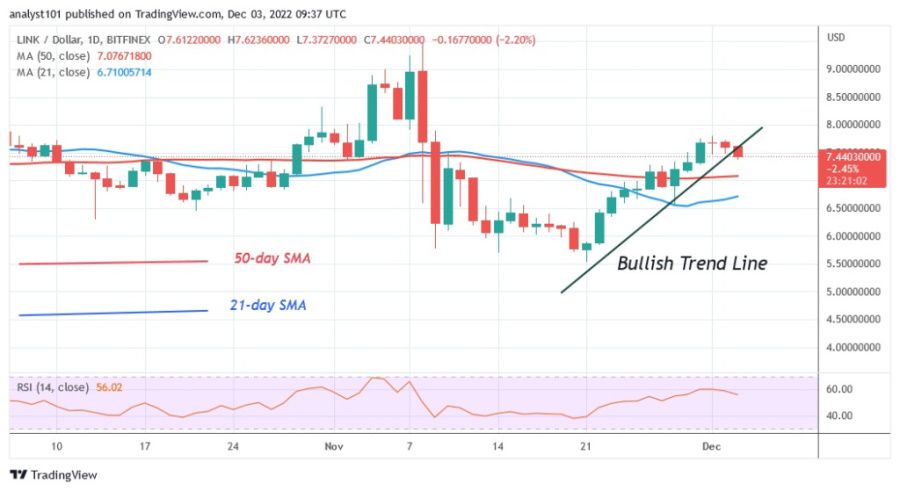
Although the price of the cryptocurrency broke through the moving average lines, it was stopped around the resistance area of $8.00. The market is overbought around the $8.00 resistance area. The fall was caused by the fact that buyers were not able to break through the resistance area. To the upside, LINK will be pushed above the current support above the $8.00 resistance area. However, the current selling pressure may extend beyond the moving average line or the low at $7.28.
Chainlink indicator display
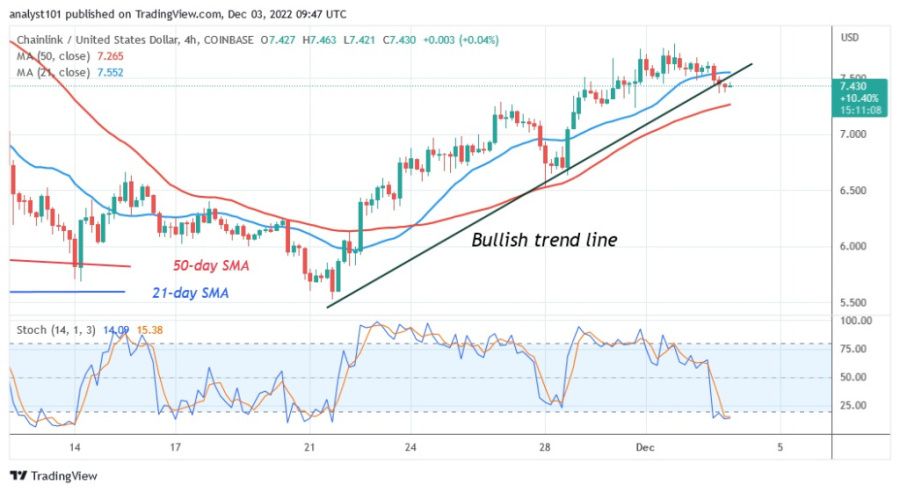
For the period 14, Chainlink’s Relative Strength Index is at 55, and now that it has reached the uptrend zone, the altcoin may continue to gain. However, the fact that the price bars are above the moving average lines suggests that prices will continue to rise. LINK is below the 20 level of the daily stochastic on the 4-hour chart. This indicates that the oversold zone of the market has been reached.

Technical indicators
Key resistance levels — $30 and $35
Important support levels — $10 and $5
What is the next move for Chainlink?
The selling pressure on Chainlink has reached bearish fatigue. The price of the cryptocurrency is between the moving average lines on the 4-hour chart. Chainlink is expected to move sideways between the moving average lines. Currently, the altcoin is falling to a low of $7.28 before it starts to move sideways again.

Disclaimer. This analysis and forecast are the personal opinions of the author and are not a recommendation to buy or sell cryptocurrency and should not be viewed as an endorsement by Coin Idol. Readers should do their own research before investing in funds.


 Bitcoin
  Ethereum
  Tether
  USDC
USDC  TRON
TRON  Dogecoin
  Cardano
  Bitcoin Cash
  Chainlink
  Monero
  LEO Token
  Stellar
  Zcash
Zcash  Litecoin
  Hedera
  Dai
Dai  Cronos
  Tether Gold
  OKB
OKB  Ethereum Classic
  KuCoin
  Gate
Gate  Algorand
  Cosmos Hub
  VeChain
  TrueUSD
  Tezos
Tezos  Dash
Dash  Stacks
  IOTA
IOTA  Basic Attention
  Theta Network
  Decred
  NEO
NEO  Synthetix
  Qtum
Qtum  Ravencoin
  DigiByte
  0x Protocol
  Nano
Nano  Zilliqa
  Siacoin
  Numeraire
  Waves
Waves  BUSD
BUSD  Status
  Pax Dollar
  Enjin Coin
  Ontology
  Hive
Hive  Lisk
Lisk  Steem
Steem  Huobi
Huobi  NEM
NEM  OMG Network
  Bitcoin Gold
  Augur
Augur  Ren
Ren  HUSD
HUSD