Crypto Markets Analysis: Bitcoin and Ether’s Flat Trajectory to Continue, Technical Indicators Suggest

Bitcoin and ether continue to trade flat, as volatility for the two assets wanes.
Bitcoin (BTC) prices stabilized following the FTX fallout, now off a mere 2% from Nov. 11. The ether price (ETH) is down a more pronounced 6% from the same date.
The most recent six months of trading activity for BTC has followed a familiar, if not exhausting pattern.
- Trade flat for a period of time.
- Decline in price following turmoil within a centralized crypto entity.
- Trade flat for a period of time at that new lower level.
Number 3 is where we are now.
Predicting the length of time that crypto assets will remain range bound is challenging, if not foolhardy. There are some cues to pay attention to, however.
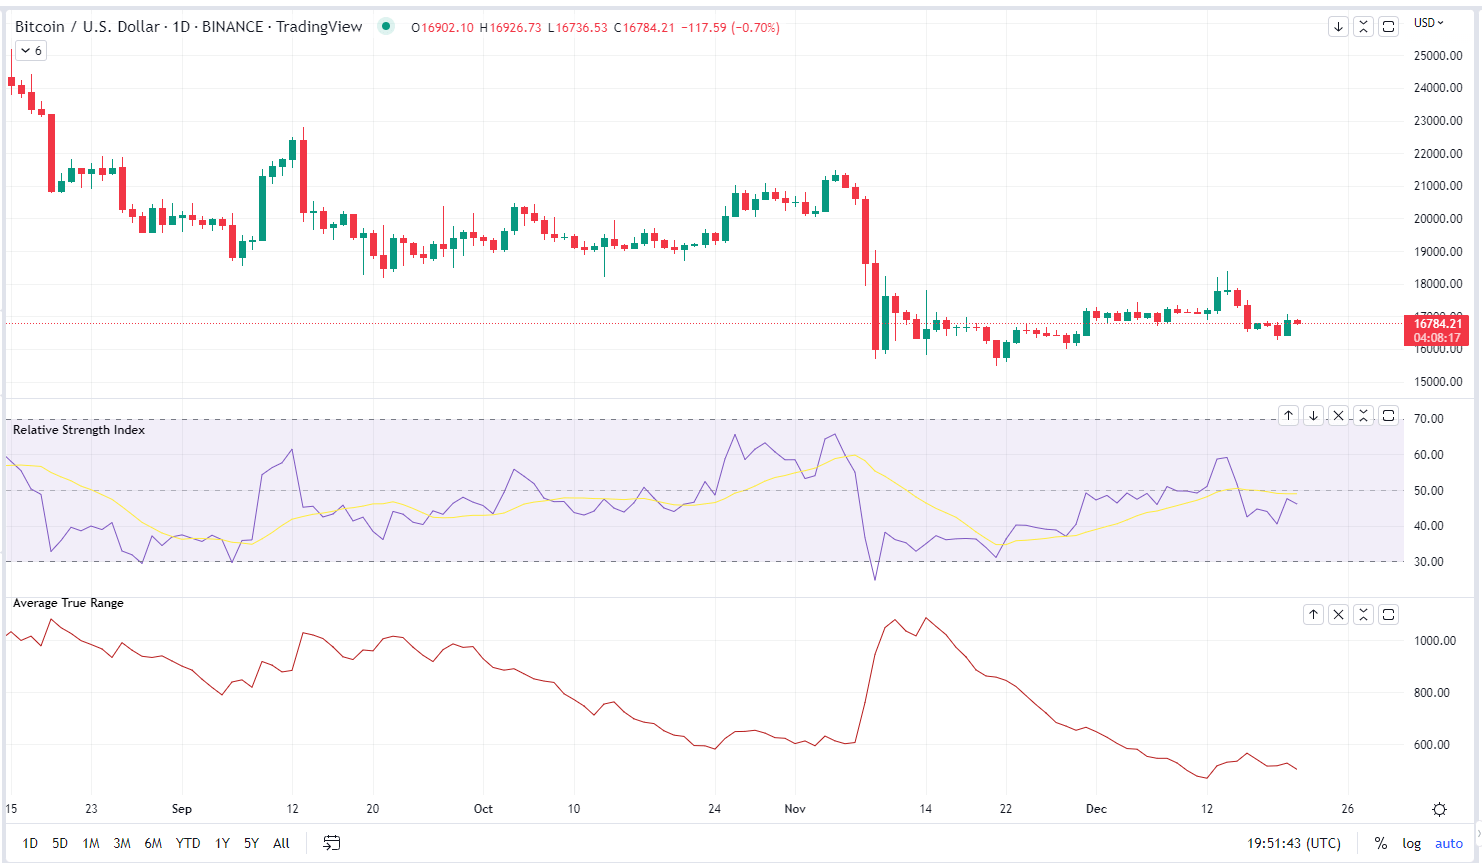
Momentum for both BTC and ETH remains in neutral territory, using the Relative Strength Indicator (RSI) as a proxy for momentum. BTC’s current RSI is approximately 49.06 – a very middling level. RSI is a technical indicator that ranges from 1-100. Readings over 70 imply that an asset is potentially overbought, while readings under 30 imply that an asset is possibly oversold.
Searching BTC data back to 2015, and filtering for RSI levels between 49 and 50 shows 61 occurrences with an average gain of 2.2%, 30 days after the fact.
For ETH, filtering for RSI levels between 47 and 49, showed 43 occurrences since 2017, with an average 30-day gain of 6.7%.
Applying those performance figures to current prices, results in prices of $17,144 for bitcoin and $1,291 for ether. This is far from earth shattering, given where both have traded in the past.
The results should not be viewed as predictive but can provide context as to where investors think prices may wind up.
Bitcoin Bollinger Bands
If using the historic data for guidance, it’s difficult to find a bullish scenario in the short term. Both price points fall within areas of significant price agreement, decreasing the likelihood of prices pushing higher without an external catalyst.
Current data doesn’t offer much either. Both BTC and ETH are both showing declines in volatility, as the Average True Range of their price movements has fallen 47% and 46% since November.
Their respective Bollinger Bands lend additional credence, as BTC and ETH have stayed closely tethered to their 20 day moving averages, straying from the mean only briefly, before reverting back.
As a counterpoint, there isn’t much of a bearish case to be made either.
The appetite of asset managers has picked up, adding to their long positions in bitcoin for three consecutive weeks.
The Commodity Futures Trading Commission’s (CFTC) Commitment of Traders report, is a weekly listing the open interest for futures and options.
The most recent release shows that asset managers now account for 40% of long open interest on the Chicago Mercantile Exchange. and are reportedly 83% long as a group.
Derivatives markets show a decline in the ratio of bitcoin put options to call options. One interpretation is that investors see declining opportunities to be profitable by betting against crypto.
Ultimately, it likely boils down to investor time horizon.
If long term biased, the current market structure likely provides you with a solid entry point. Shorter term traders however may be turned off by the lack of price movement.

Bitcoin 12/21/22 (TradingView)


 Bitcoin
  Ethereum
  Tether
  USDC
USDC  TRON
TRON  Dogecoin
  Cardano
  Bitcoin Cash
  Chainlink
  Monero
  LEO Token
  Zcash
Zcash  Stellar
  Litecoin
  Hedera
  Dai
Dai  Cronos
  Tether Gold
  OKB
OKB  Ethereum Classic
  KuCoin
  Gate
Gate  Algorand
  Cosmos Hub
  VeChain
  Dash
Dash  Tezos
Tezos  TrueUSD
  Stacks
  IOTA
IOTA  Basic Attention
  Theta Network
  Decred
  NEO
NEO  Synthetix
  Qtum
Qtum  Ravencoin
  DigiByte
  0x Protocol
  Nano
Nano  Zilliqa
  Siacoin
  Numeraire
  Waves
Waves  Status
  BUSD
BUSD  Enjin Coin
  Pax Dollar
  Ontology
  Hive
Hive  Lisk
Lisk  Steem
Steem  Huobi
Huobi  NEM
NEM  OMG Network
  Bitcoin Gold
  Augur
Augur  Ren
Ren  HUSD
HUSD