BSV Price Reaches $42.52; Breaking $42.76 Could Lead to Further Gains

At the opening of the market, Bitcoin SV (BSV) was valued at $40.88, with buyers in the driver’s seat. Although bulls maintained their day-to-day hegemony in the BSV market, they did have to recover from a series of brief periods of bear dominance that saw prices tumbling to an intraday low of $40.44.
This surge was underpinned by a rise in market capitalization and 24-hour trading volume of 3.90% to $818,169,237 and 64.60% to $46,352,199, respectively.

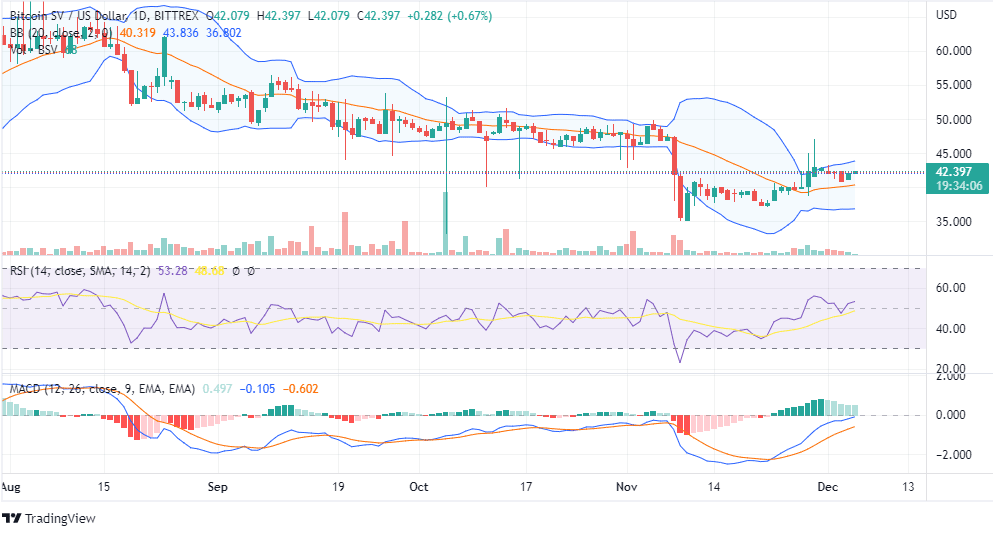
BSV/USD 24-hour price chart (source: TradingView)
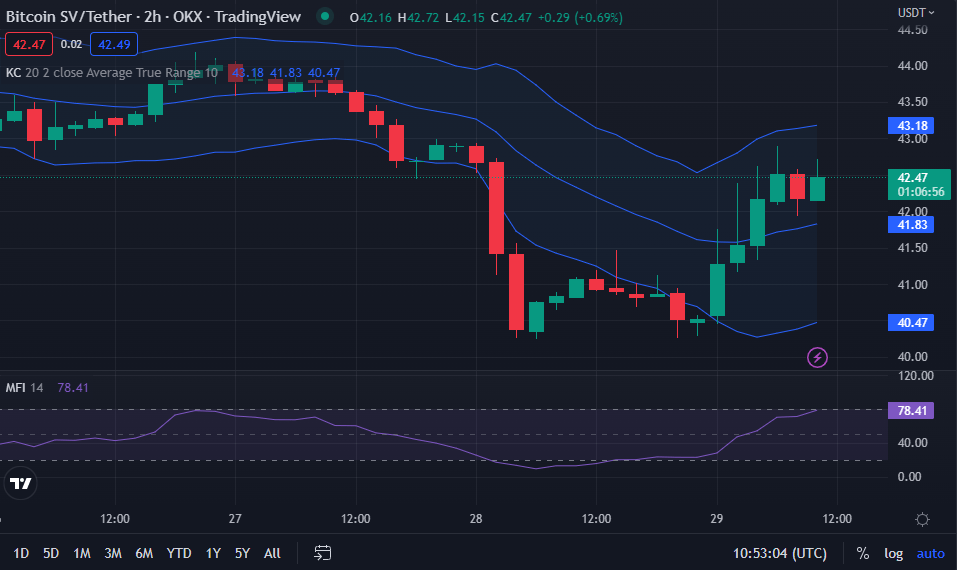
When the Money Flow Index (MFI) is greater than 50, the bulls win, and when it is less than 50, the bears win. MFI values greater than 80 are considered overbought, while levels less than 20 are considered undersold. As a result, signaling that the positive trend in BSV has yet to reach its peak, the MFI on its price chart reads 78.26 and points upward, implying that the bullish run may endure.
The Keltner Channel bands are broadening, supporting the premise that the upward trend will continue in the short run, with the top band at 43.18 and the lower band at 40.48. This movement indicates that market volatility is increasing, and a bullish candlestick is forming as the price oscillates above the signal line. These indicators show that bull vigor is increasing, raising the prospect of another bull run.

BSV/USD 2-hour price chart (source: TradingView)
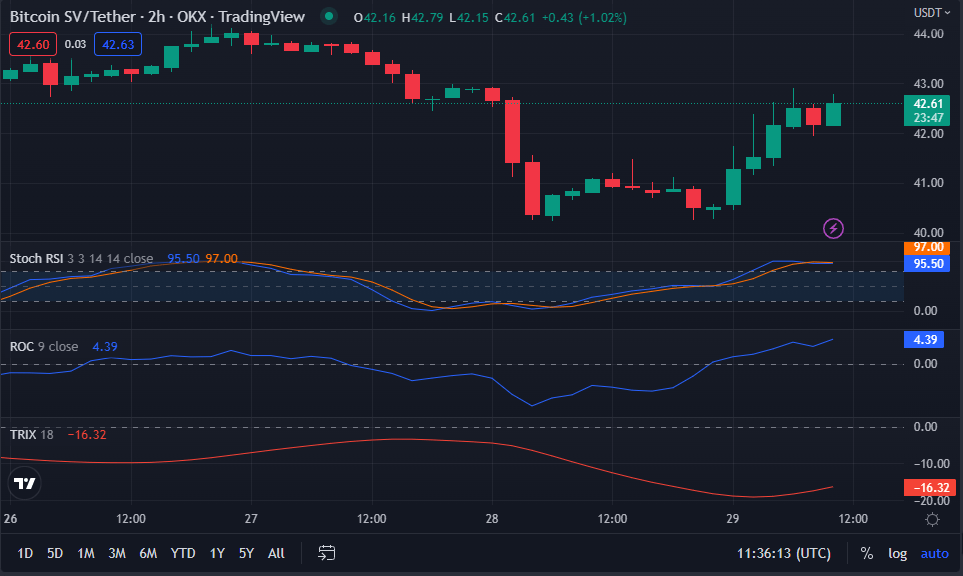
With a stochastic RSI reading of 93.61 and a move below the signal line, traders are warned that a reversal in the BSV market is possible if bulls’ hold weakens. This, however, merely acts as a warning to traders to exercise prudence in the immediate future.
This bullish trend is expected to continue for the foreseeable future as the indicator is at 4.07 and trending higher. The BSV market’s optimistic outlook is further bolstered by the rate of change moving into positive territory.
Momentum is said to be building when the value is positive and declining when it is negative. It is widely held that a purchase signal is generated whenever the TRIX closes above the zero line and a sell signal is generated once it closes below the zero line. As a result, buying pressure is fading in the BSV market, with the current reading being -16.32 points below the impartial zero line.

BSV/USD 2-hour price chart (source: TradingView)
Ultimately, the bears seem fatigued, as technical indicators are rising north, suggesting that the bullish trend may continue.
Disclaimer: The views and opinions, as well as all the information shared in this price prediction, are published in good faith. Readers must do their research and due diligence. Any action taken by the reader is strictly at their own risk. Coin Edition and its affiliates will not be held liable for any direct or indirect damage or loss.


 Bitcoin
  Ethereum
  Tether
  USDC
USDC  TRON
TRON  Dogecoin
  Cardano
  Bitcoin Cash
  Chainlink
  Monero
  Stellar
  LEO Token
  Zcash
Zcash  Litecoin
  Hedera
  Dai
Dai  Cronos
  Tether Gold
  OKB
OKB  Ethereum Classic
  KuCoin
  Gate
Gate  Algorand
  Cosmos Hub
  VeChain
  TrueUSD
  Dash
Dash  Tezos
Tezos  Stacks
  IOTA
IOTA  Basic Attention
  Theta Network
  NEO
NEO  Decred
  Synthetix
  Qtum
Qtum  Ravencoin
  DigiByte
  0x Protocol
  Nano
Nano  Zilliqa
  Siacoin
  Numeraire
  Waves
Waves  BUSD
BUSD  Status
  Enjin Coin
  Pax Dollar
  Ontology
  Hive
Hive  Lisk
Lisk  Steem
Steem  Huobi
Huobi  NEM
NEM  OMG Network
  Bitcoin Gold
  Augur
Augur  Ren
Ren  HUSD
HUSD