Bullish Technical Indicators Suggest Good Days Ahead For DOGE

Dogecoin (DOGE) is one of the cryptocurrencies in the green for the day so far. According to CoinMarketCap, DOGE is currently trading at $0.07371 after a 1.68% increase in price over the last 24 hours. The meme coin was also able to reach a high of $0.07503 and a low of $0.07181 over the same time period.
DOGE’s weekly performance is also looking good as the crypto is up almost 4% over the last seven days. Doge was also able to strengthen against Bitcoin (BTC) and Ethereum (ETH) by about 1.93% and 1.68% respectively over the last day.
Also in the green zone is DOGE’s 24-hour trading volume which currently stands at $392,982,554 after a more than 12% increase since yesterday. With its market cap of $9,785,460,701, DOGE is currently the 8th biggest crypto in terms of market capitalization.

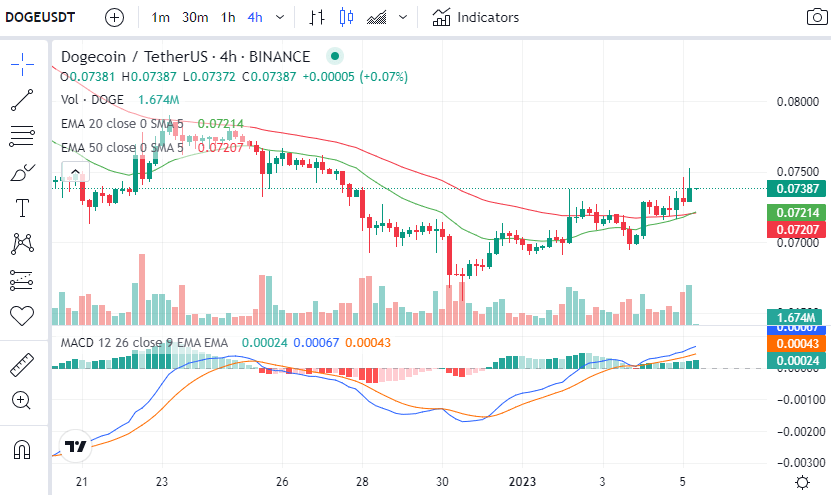
4-hour chart for DOGE/USDT (Source: CoinMarketCap)
The price of DOGE is currently trading above the 20 and 50 EMA lines on its 4-hour chart, and was battling it out with the resistance level at $0.07377 at press time.
Technical indicators on DOGE’s 4-hour chart suggest that bulls have stepped in to give DOGE the support it needs to break the current resistance level. The MACD indicator is showing bullishness as the MACD signal line is positioned above the MACD SMA line. In addition to this, the slope of the histogram gradient has become more positive.
A major bullish confirmation would be the 20 EMA line crossing above the 50 EMA line. Looking at DOGE’s 4-hour chart, this cross is on the verge of happening.
Disclaimer: The views and opinions, as well as all the information shared in this price analysis, are published in good faith. Readers must do their own research and due diligence. Any action taken by the reader is strictly at their own risk. Coin Edition and its affiliates will not be held liable for any direct or indirect damage or loss.


 Bitcoin
  Ethereum
  Tether
  USDC
USDC  TRON
TRON  Dogecoin
  Cardano
  Bitcoin Cash
  Chainlink
  Monero
  LEO Token
  Zcash
Zcash  Stellar
  Litecoin
  Hedera
  Dai
Dai  Cronos
  Tether Gold
  OKB
OKB  Ethereum Classic
  KuCoin
  Gate
Gate  Algorand
  Cosmos Hub
  VeChain
  Tezos
Tezos  Dash
Dash  TrueUSD
  Stacks
  IOTA
IOTA  Basic Attention
  Decred
  Theta Network
  NEO
NEO  Synthetix
  Qtum
Qtum  Ravencoin
  DigiByte
  0x Protocol
  Nano
Nano  Zilliqa
  Holo
Holo  Siacoin
  Numeraire
  Waves
Waves  BUSD
BUSD  Status
  Ontology
  Enjin Coin
  Pax Dollar
  Lisk
Lisk  Hive
Hive  Steem
Steem  Huobi
Huobi  OMG Network
  NEM
NEM  Bitcoin Gold
  Augur
Augur  HUSD
HUSD