ImmutableX (IMX) Price Prediction : IMX price preparing for upside or downside expansion ?

- ImmutableX crypto price is consolidating near to yearly lows at $0.376 and likely to approach 50 day EMA
- IMX crypto price is stuck in the narrow range between $0.376 and $0.500 and likely to expand on either side soon.
ImmutableX crypto price is trading with mild bullish cues and bulls are trying to continue the upside momentum. As per coinglass, In the last 12 hours, IMX Long and Short ratio stands at 1.2 denotes buyers are more as compared to sellers. As of now, IMX/USDT is trading at $0.422 with the intraday gains of 0.24% and 24 hour volume to market ratio stood at 0.0187
Will the IMX expand upside or downside ?

Source : IMX/USDT daily chart by Tradingview
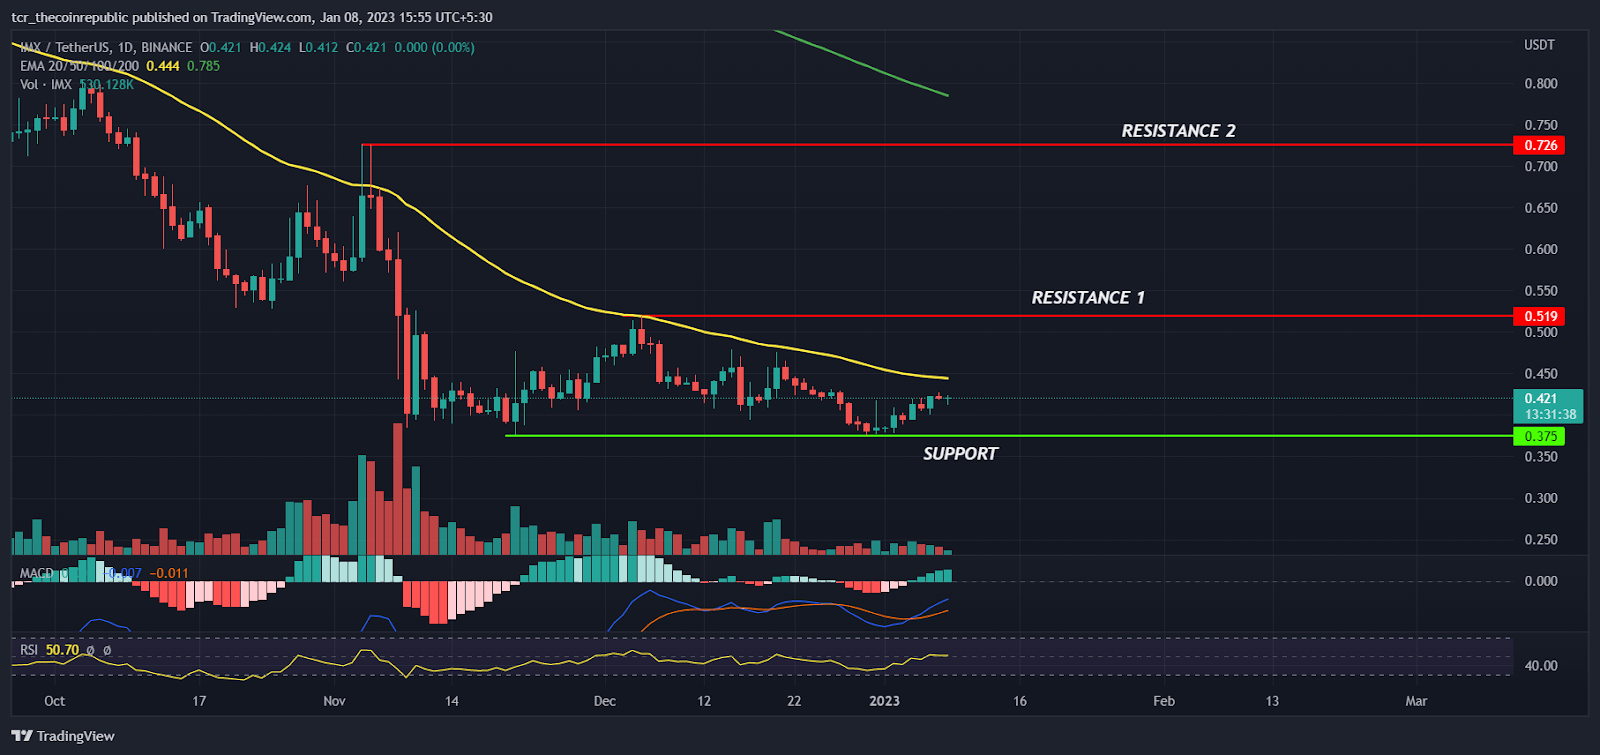
On a daily time frame, IMX crypto price had been in downtrend and falling down while forming lower low swings. In November IMX became a victim of FTX collapse and prices brokedown important support level of $0.500 with a massive bearish candle and hit a low at $0.384. After a little bit consolidation at lower levels bulls gained some positive momentum and tried to reclaim above $0.500, but it acted as resistance and prices stuck in the narrow range between $0.375 to $0.500.
Recently, prices had tested the support level at $0.375 and reversed upwards while forming a higher high candle but it will be difficult for bulls to trade above the 50 day EMA (yellow) at $0.444 due to bear dominance at higher levels. However, if bulls succeed to break out of the EMA the next hurdle will be at $0.519 to $0.726.
On a lower side $0.375 is acting as a support for bulls and if prices drop below $0.375 we may see downside expansion in IMX prices. The MACD generated a positive crossover indicates mild bullishness and the RSI at 50 sloping sideways denotes neutral sentiment in bullish and bearish positions.
Will the short term trend continue in the favor of bulls ?

Source : IMX/USDT 4 hour chart by Tradingview
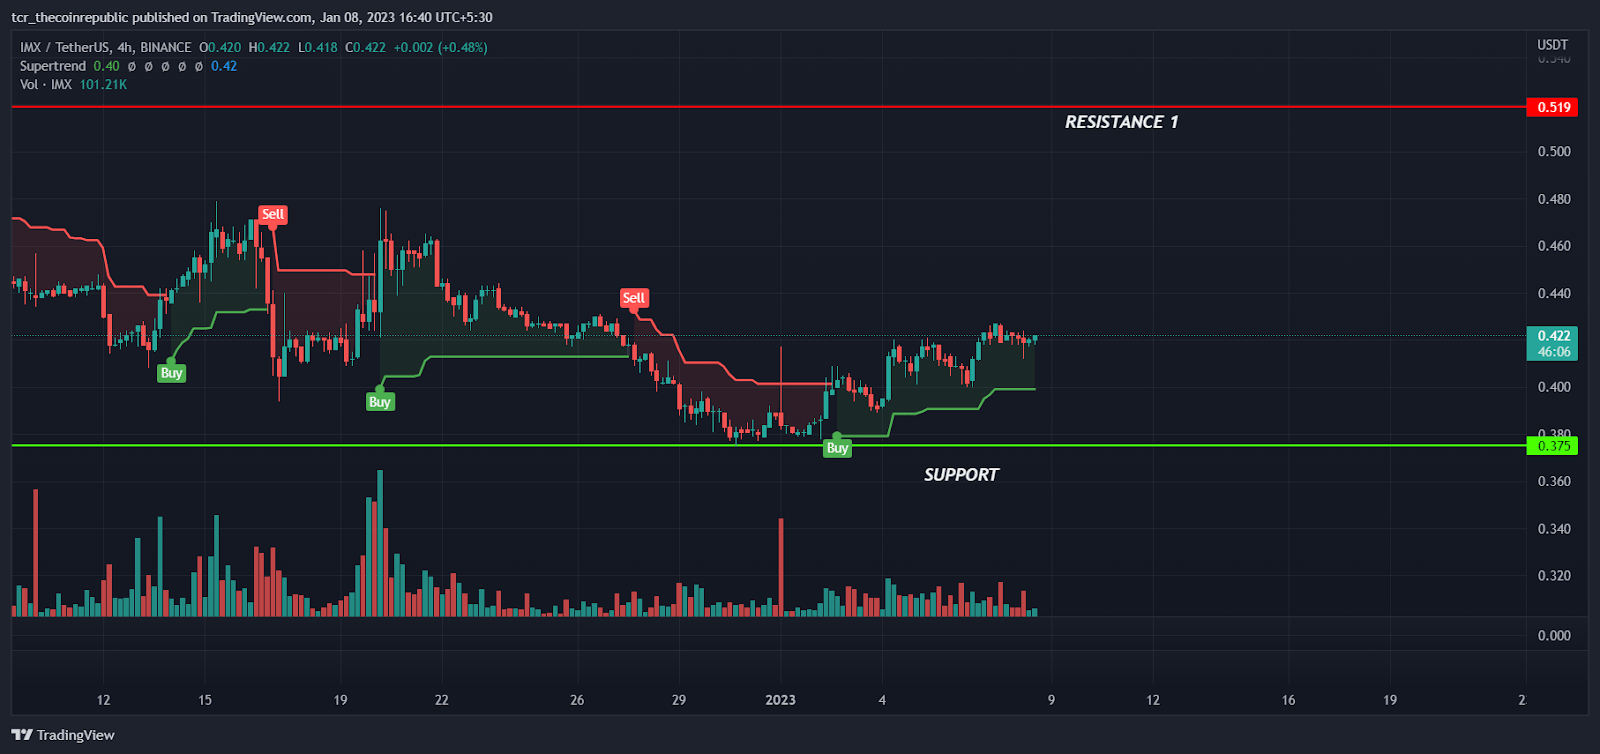
At a lower time, IMX crypto price is reversing upside while forming higher high swings but it seems like prices are lacking the momentum and it will be difficult for bulls to hold the higher levels. However, the supertrend indicator had generated a buy signal indicating the short term trend may work in the favor of bulls but if prices slipped below $0.400 the trend reversal will become doubtful.
Summary
As per technical analysis, till IMX crypto prices are trading below 50 day EMA and $0.500 hurdle level, the probability of downside expansion is higher as compared to upside expansion. However, If bulls succeed to trade above 50 day EMA the bulls may challenge the bears at higher levels.
Technical levels
Resistance levels : $0.519 and $0.726
Support levels : $0.375 and $0.300
Disclaimer
The views and opinions stated by the author, or any people named in this article, are for informational ideas only, and they do not establish financial, investment, or other advice. Investing in or trading crypto assets comes with a risk of financial loss.


 Bitcoin
  Ethereum
  Tether
  USDC
USDC  TRON
TRON  Dogecoin
  Cardano
  Bitcoin Cash
  Chainlink
  Monero
  LEO Token
  Zcash
Zcash  Stellar
  Litecoin
  Hedera
  Dai
Dai  Cronos
  Tether Gold
  OKB
OKB  Ethereum Classic
  KuCoin
  Gate
Gate  Algorand
  Cosmos Hub
  VeChain
  TrueUSD
  Dash
Dash  Tezos
Tezos  Stacks
  IOTA
IOTA  Basic Attention
  Theta Network
  Decred
  NEO
NEO  Synthetix
  Qtum
Qtum  Ravencoin
  DigiByte
  0x Protocol
  Nano
Nano  Zilliqa
  Siacoin
  Numeraire
  Waves
Waves  BUSD
BUSD  Status
  Pax Dollar
  Enjin Coin
  Ontology
  Hive
Hive  Lisk
Lisk  Steem
Steem  Huobi
Huobi  OMG Network
  NEM
NEM  Bitcoin Gold
  Augur
Augur  Ren
Ren  HUSD
HUSD  Bitcoin Diamond