SHIB Price Analysis for February 12
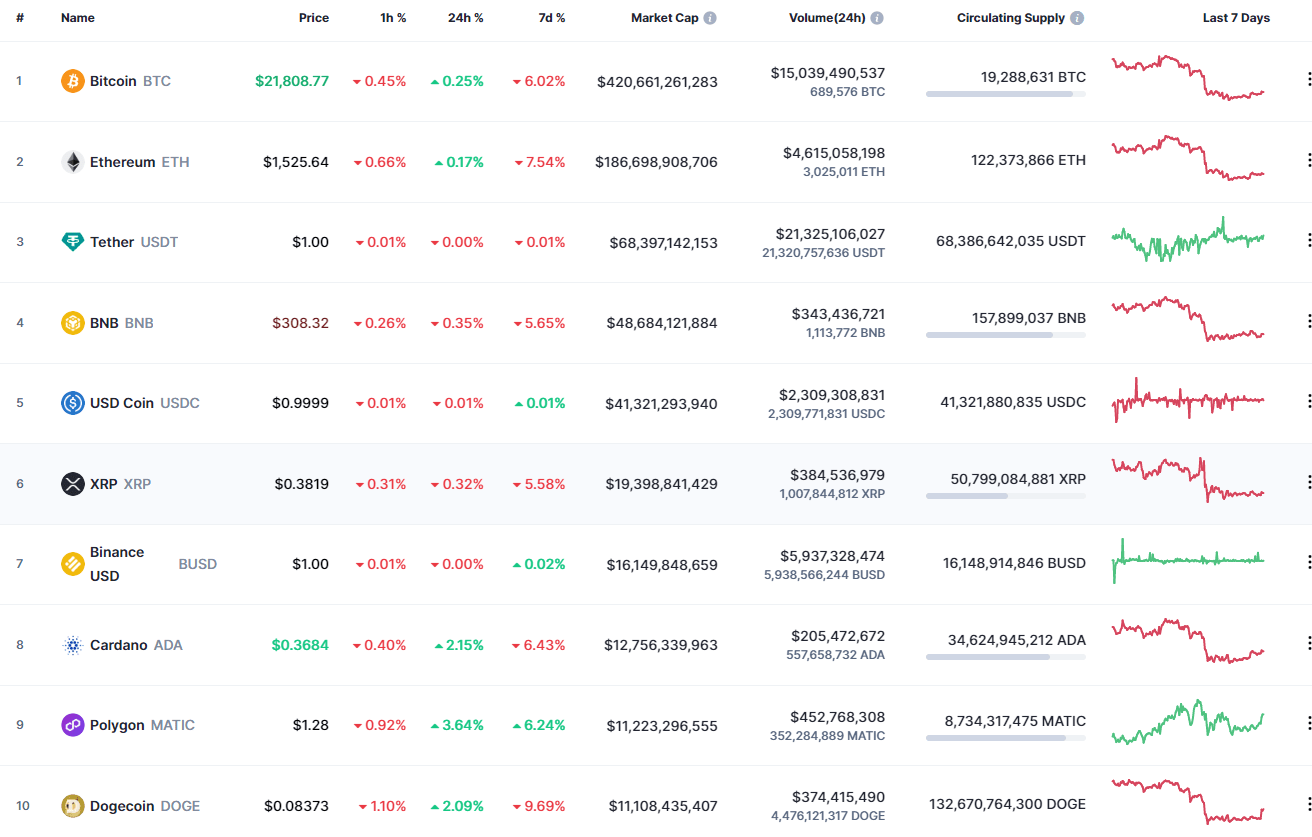
The last day of the week is more bearish than bullish for most of the coins.
SHIB/USD
While the rates of other coins are falling, the price of SHIB has increased by 1.88% over the last 24 hours.
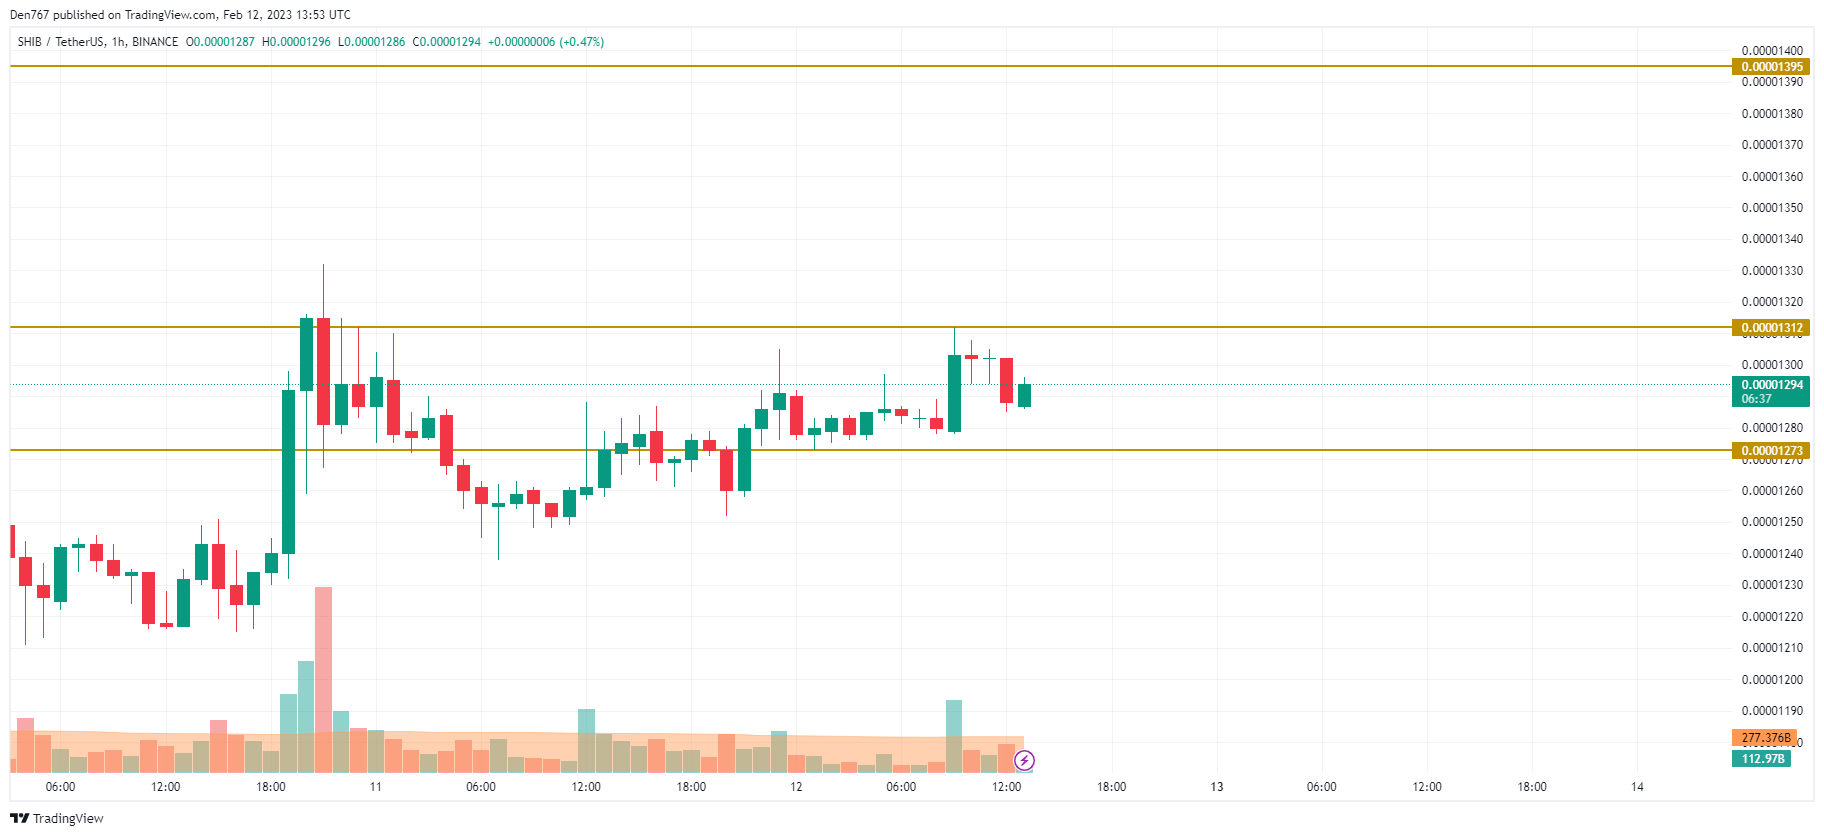
On the local chart, SHIB is neither bullish nor bearish as the price is located in the middle of the channel between the support at $0.00001273 and the resistance at $0.00001312. Buyers might think about further growth only if they can fix the price above the $0.000013 zone.

On the bigger time frame, the price of SHIB has bounced back from yesterday’s peak at $0.00001310. However, one should pay attention to the closure of the candle.
If it happens near the level and with no wicks, traders might see a price blast tomorrow followed by growth to the $0.00001350 mark.
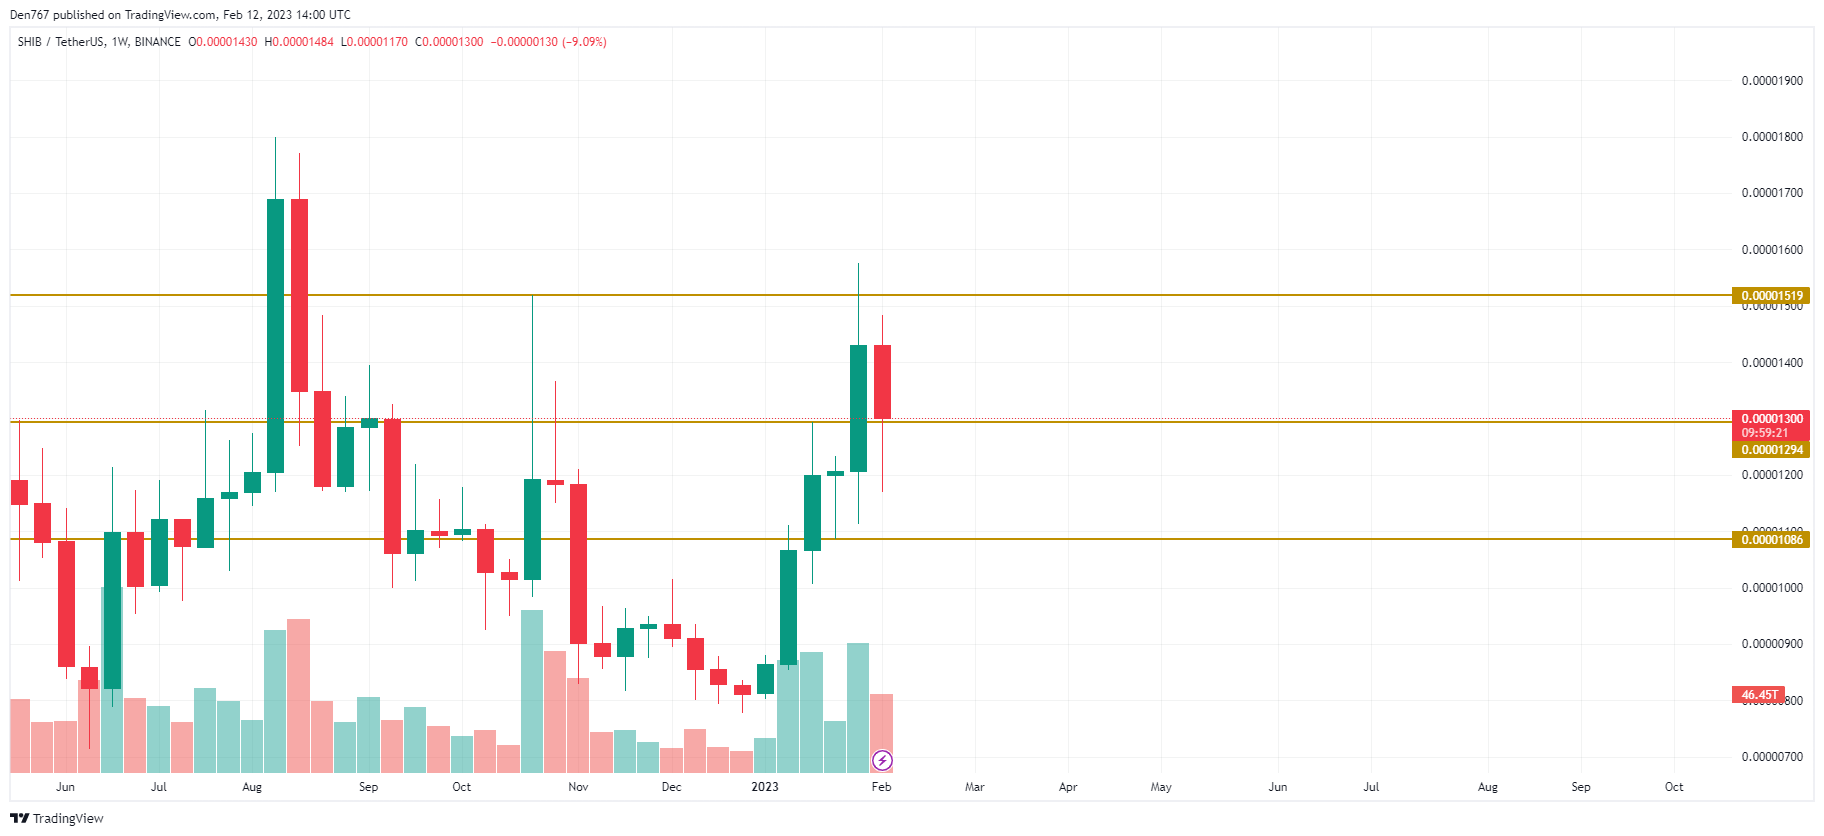
On the weekly chart, SHIB is trying to form a false breakout of the formed support at $0.00001294. If buyers manage to do that and the bar closes above that mark, there is a chance to see local growth to the $0.00001350 zone.
SHIB is trading at $0.000013 at press time.




 Bitcoin
  Ethereum
  Tether
  USDC
USDC  Dogecoin
  Cardano
  TRON
TRON  Chainlink
  Stellar
  LEO Token
  Hedera
  Bitcoin Cash
  Litecoin
  Monero
  Dai
Dai  OKB
OKB  Gate
Gate  Ethereum Classic
  Cronos
  VeChain
  Cosmos Hub
  Algorand
  KuCoin
  Maker
Maker  Stacks
  Tether Gold
  IOTA
IOTA  Theta Network
  Zcash
Zcash  Tezos
Tezos  TrueUSD
  NEO
NEO  Polygon
  Dash
Dash  Zilliqa
  Synthetix Network
  0x Protocol
  Qtum
Qtum  Basic Attention
  Decred
  Siacoin
  Holo
Holo  Ravencoin
  NEM
NEM  DigiByte
  Enjin Coin
  Ontology
  Nano
Nano  Hive
Hive  Waves
Waves  Lisk
Lisk  Status
  Steem
Steem  Numeraire
  Pax Dollar
  BUSD
BUSD  Huobi
Huobi  OMG Network
  Bitcoin Gold
  Ren
Ren  Bitcoin Diamond
  HUSD
HUSD  Bytom
Bytom