Stellar (XLM) Bulls in Despair as Price Struggles Continue

Stellar (XLM) is trading above an important Fib support level but shows no bullish signs whatsoever.
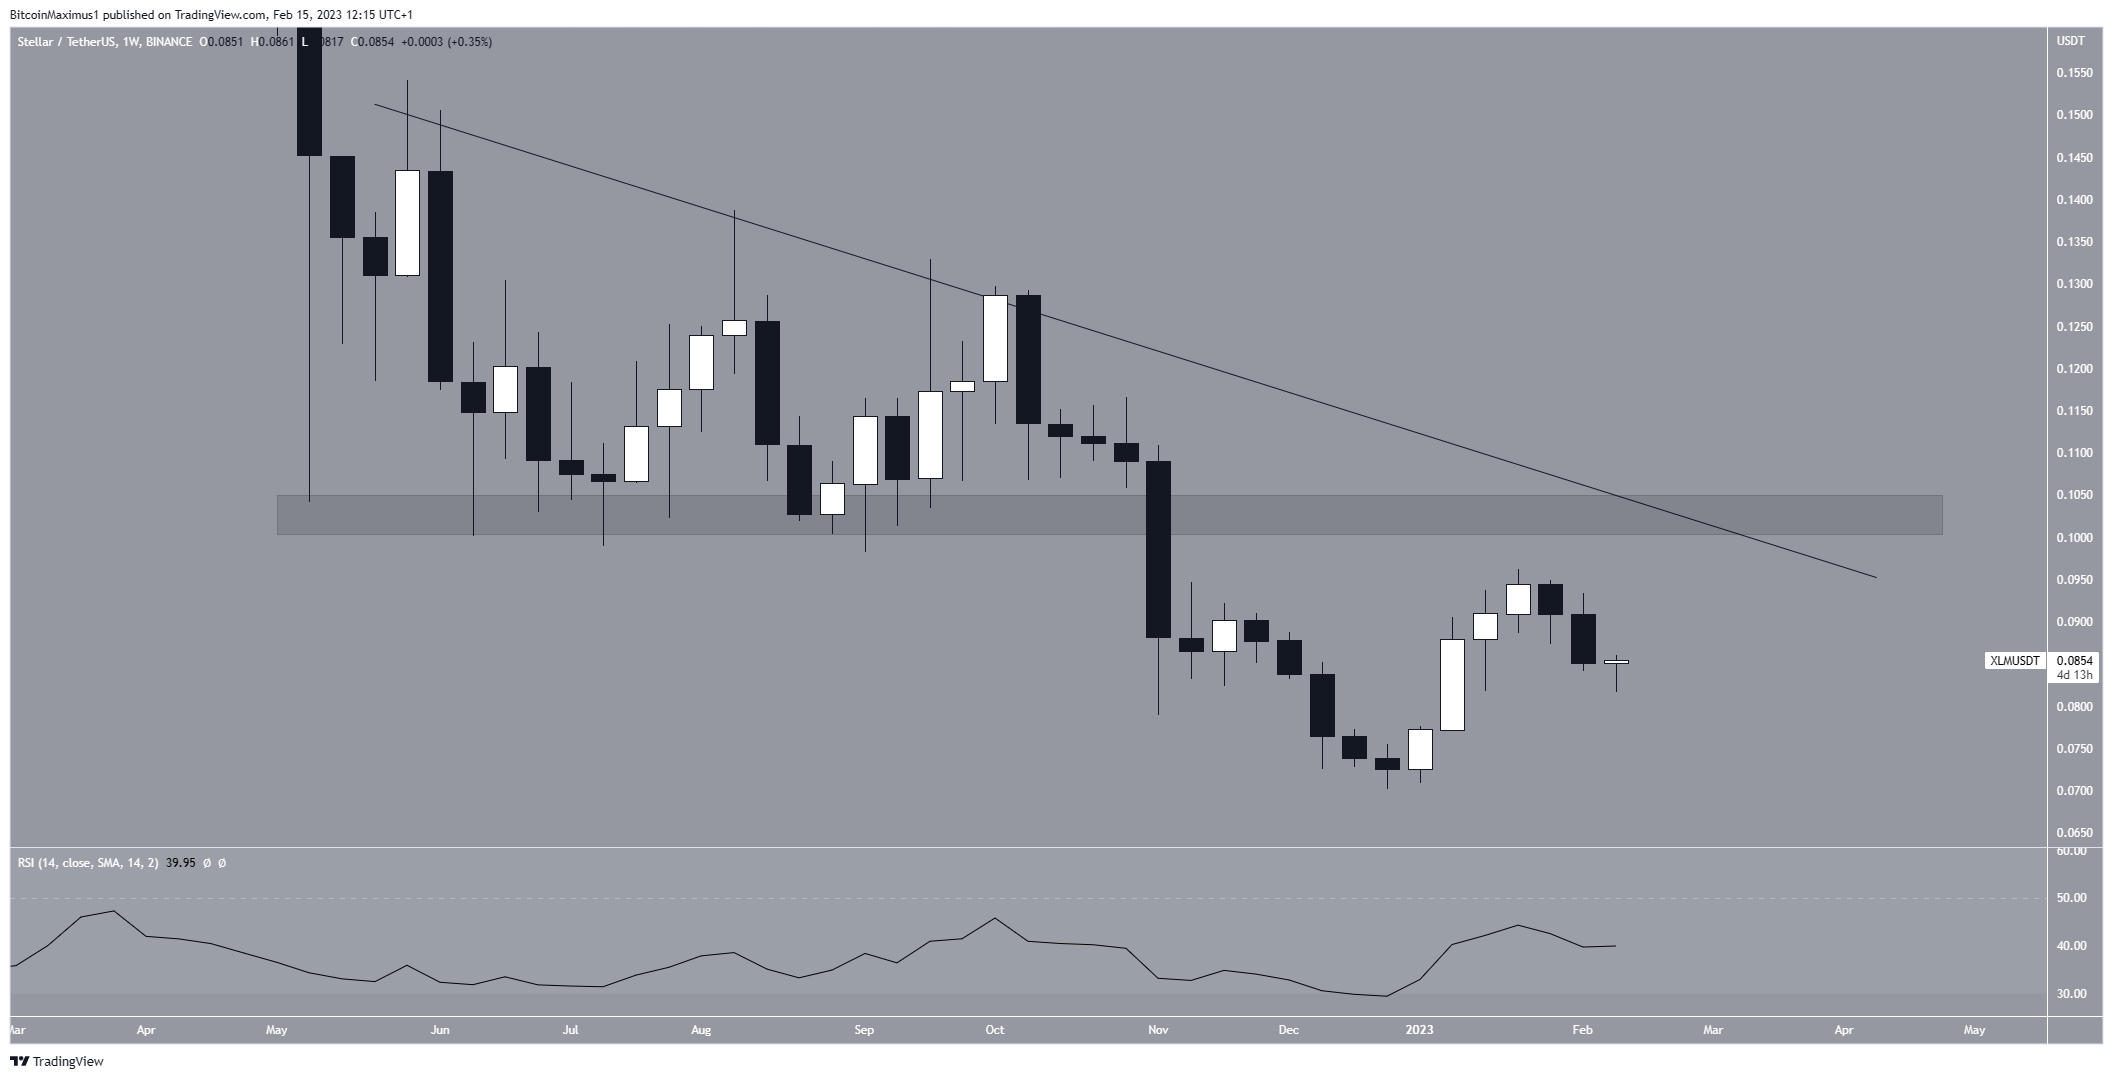
The Stellar network’s native token is XLM. It aspires to be a payment network for financial systems that focuses on underdeveloped areas of the world. In the weekly time frame, the digital currency formed four bullish candlesticks in Jan. However, they were followed by two bearish candlesticks in Feb. Last week’s candle was especially bearish since the close was near its lows.
The weekly time frame provides a relatively bearish outlook. The price still trades below the $0.102 resistance area and a descending resistance line. The trend can only be considered bullish once it breaks out.
A successful breakout could take the XLM price to $0.130. However, failure to do so could cause a sharp fall toward $0.045.
The weekly RSI is below 50, hence it gives XLM price a bearish reading.

XLM/USDT Weekly Chart. Source: TradingView
Can Stellar Recover at Fib Support?
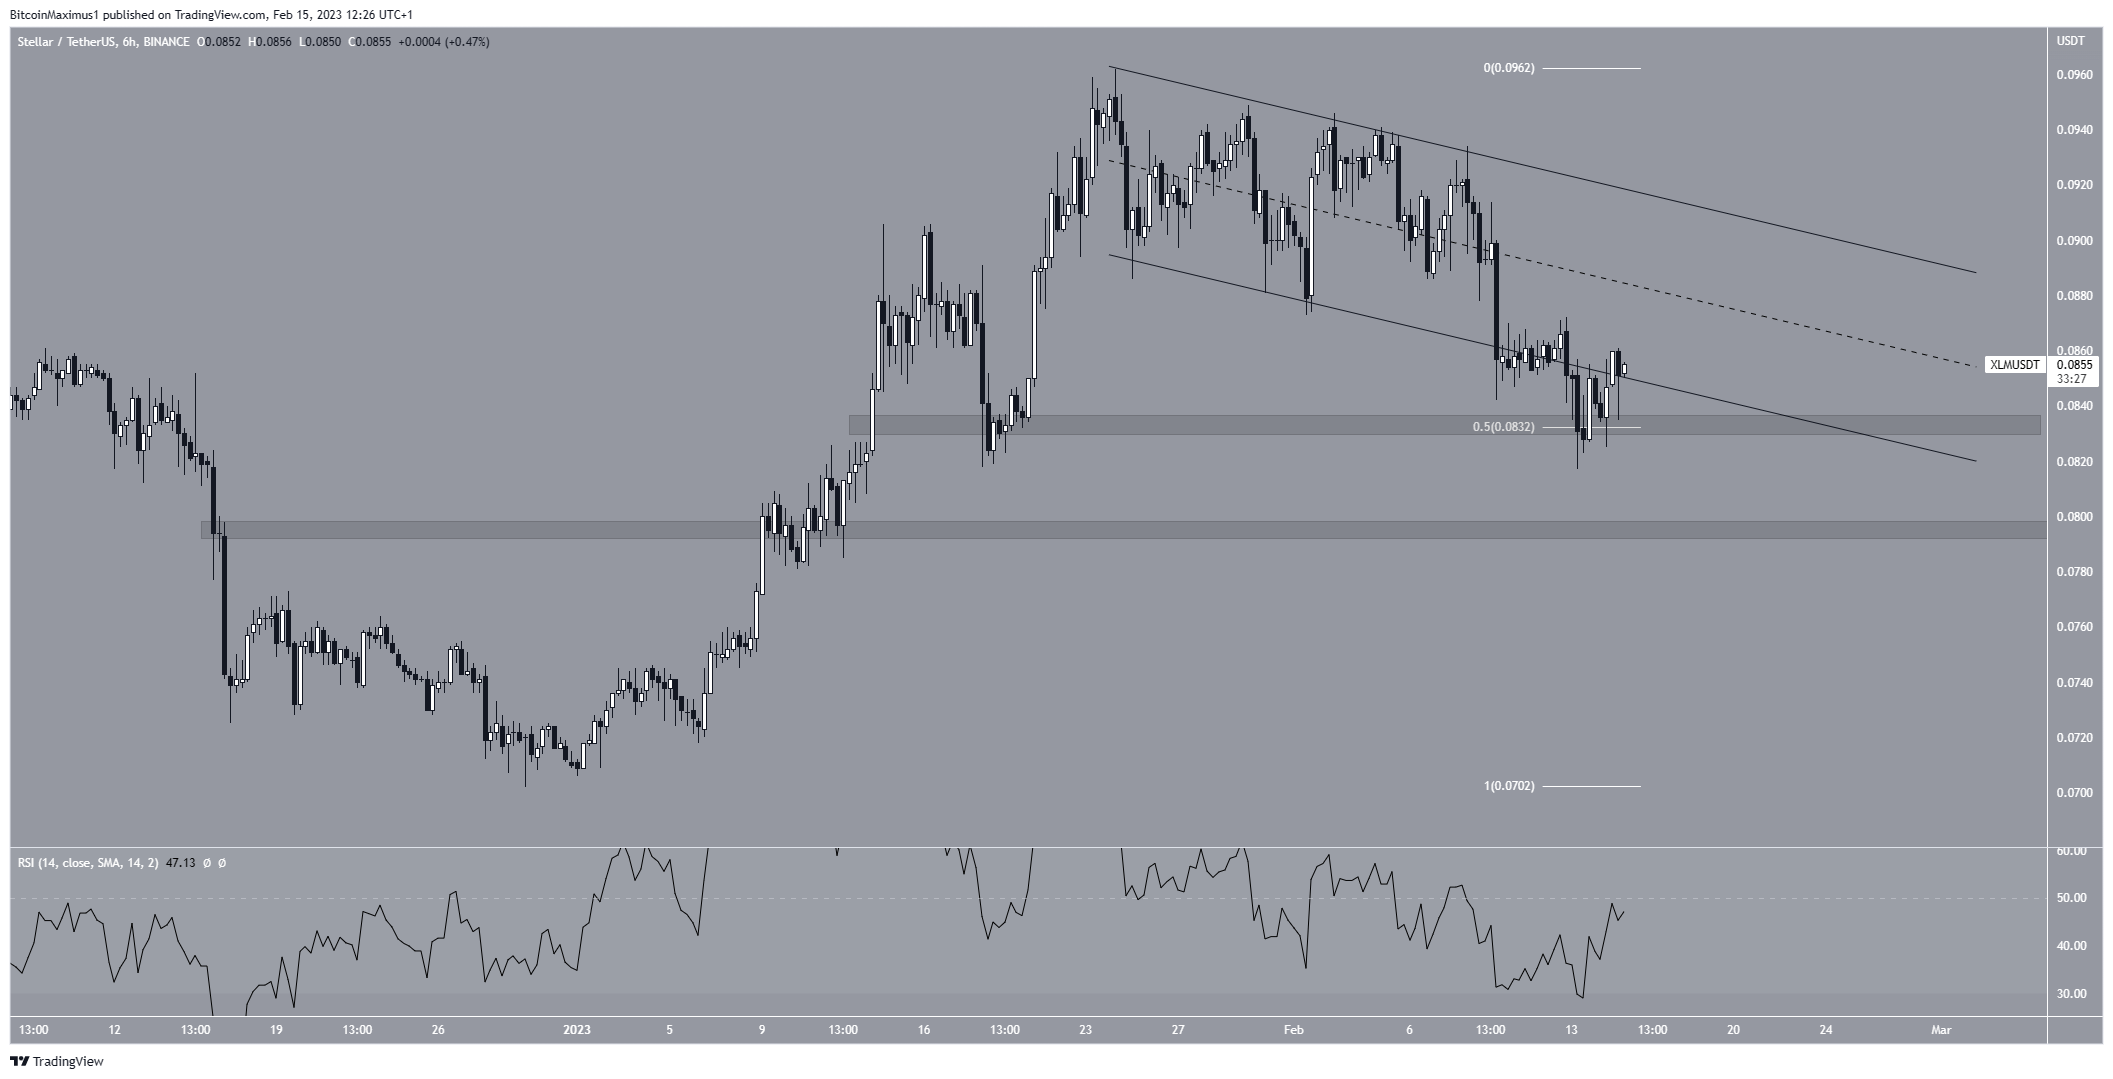
The short-term six-hour chart shows that the Stellar price broke down from a descending parallel channel. While it has moved above it, it has yet to reclaim its support line due to numerous rejections.
Currently, the Stellar price is very close to a confluence of support levels near $0.083. The 0.5 Fib retracement support level and a horizontal support area create the support.
If the price breaks down from it, it could fall to the next support at $0.079. On the other hand, a movement above the channel’s resistance could take the XLM price to the long-term resistance at $0.102. Currently, there are no signs that indicate this might occur.

XLM/USDT Six-Hour Chart. Source: TradingView
To conclude, the most likely Stellar price forecast is the continuation of the drop toward $0.079. This bearish forecast would be negated by a breakout from the current short-term resistance line, which could then lead to an increase toward $0.102.


 Bitcoin
  Ethereum
  Tether
  USDC
USDC  TRON
TRON  Dogecoin
  Cardano
  Bitcoin Cash
  Chainlink
  LEO Token
  Zcash
Zcash  Monero
  Stellar
  Litecoin
  Hedera
  Dai
Dai  Cronos
  OKB
OKB  Tether Gold
  Ethereum Classic
  KuCoin
  Gate
Gate  Algorand
  Cosmos Hub
  VeChain
  Tezos
Tezos  Dash
Dash  TrueUSD
  Stacks
  IOTA
IOTA  Basic Attention
  Decred
  Theta Network
  NEO
NEO  Synthetix
  Qtum
Qtum  0x Protocol
  Ravencoin
  DigiByte
  Zilliqa
  Nano
Nano  Holo
Holo  Siacoin
  Numeraire
  Waves
Waves  Ontology
  Enjin Coin
  Status
  BUSD
BUSD  Hive
Hive  Pax Dollar
  Lisk
Lisk  Steem
Steem  Huobi
Huobi  OMG Network
  NEM
NEM  Bitcoin Gold
  Ren
Ren  Augur
Augur  Bitcoin Diamond