The global macro picture 2023

Summary
- 3 Themes for 2023
- From Peak to Trough Inflation
- Wave 5s across markets
- NASDAQ – Wave 5 Lower
- US 10-year yield – Wave 5 Higher
- US Dollar (DXY) – Wave 5 Higher
- ETH – Wave 5 Lower
- BTC – Wave 5 Lower
- Dot.com parallels
- In summary
3 Themes for 2023
- From Peak to Trough Inflation
- Wave 5s across markets
- Dot.com parallels
From Peak to Trough Inflation
The question of where is “Peak Inflation” in 2022, will now turn to where is “Trough Inflation” in 2023.
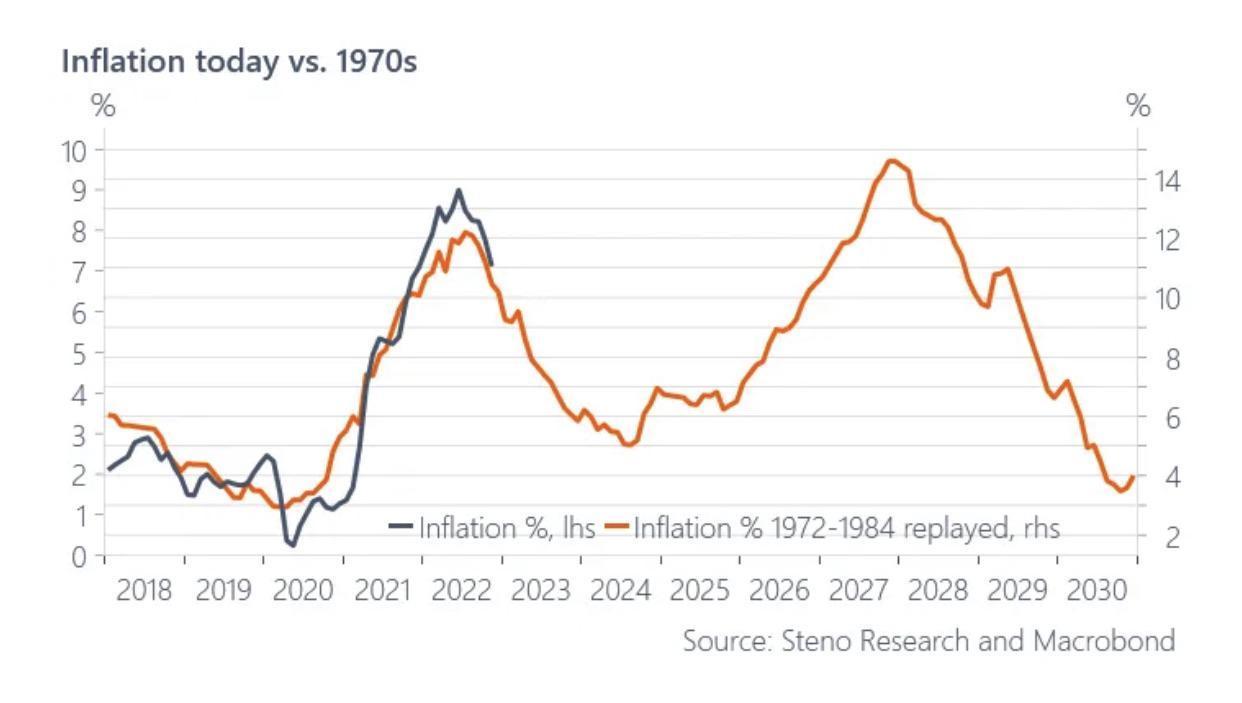
The 9.1% YoY CPI in July 2022 now looks very likely to hold as the peak of inflation this cycle.
However an analog to the stagflationary 1970s shows that while the inflation downturn is imminent, it is likely it will not reach the Fed’s 2% target. More worryingly, there is also a significant risk of a V-shaped rebound if the Fed loosens policy prematurely.
Source: Steno Research, Macrobond
What could drive this stickier and possibly V-shaped inflation trajectory?
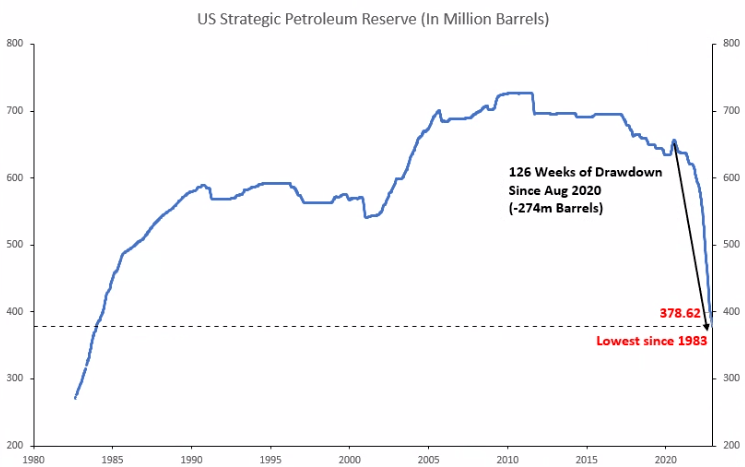
- A resurgence of oil prices due to China reopening its borders; and an escalation in Ukraine coupled with the US refilling its SPR reserves on the back of geopolitical tensions.
- Oil prices back above $100 would drive a significant and entirely unexpected rebound in inflation.
We recall it was OPEC’s oil embargo in October 1973 that quadrupled oil prices, leading to the V-shape rebound of the 1970-80s, just when Arthur Burns’ Fed thought that they too had conquered inflation.
Source: Bloomberg, QCP Insights
A spike in oil prices will reverse the Goods deflation we are seeing now. Goods deflation is the only reason we are seeing overall CPI disinflation now.
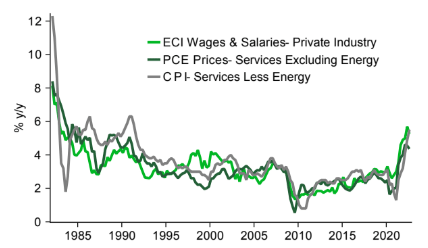
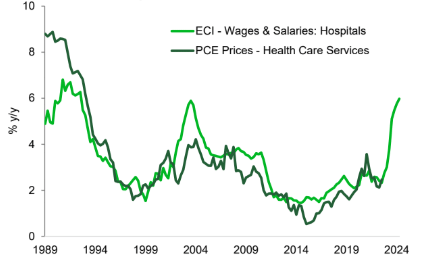
Services inflation will continue to remain strong, as the tight relationship between wages and service prices continues. And with wages in many sectors still on the uptrend, the worst of the inflationary pass-through is still yet to hit for many service sectors!
Source: BLS, BEA, TD Securities
Source: BLS, BEA, TD Securities
Fears of the same double-dip inflation as the 1970-80s is deeply edged in the FOMC’s psyche.
This will lead them to accept a recession rather than risk a rebound in inflation, even if the inflation spike is again due to supply side shocks.
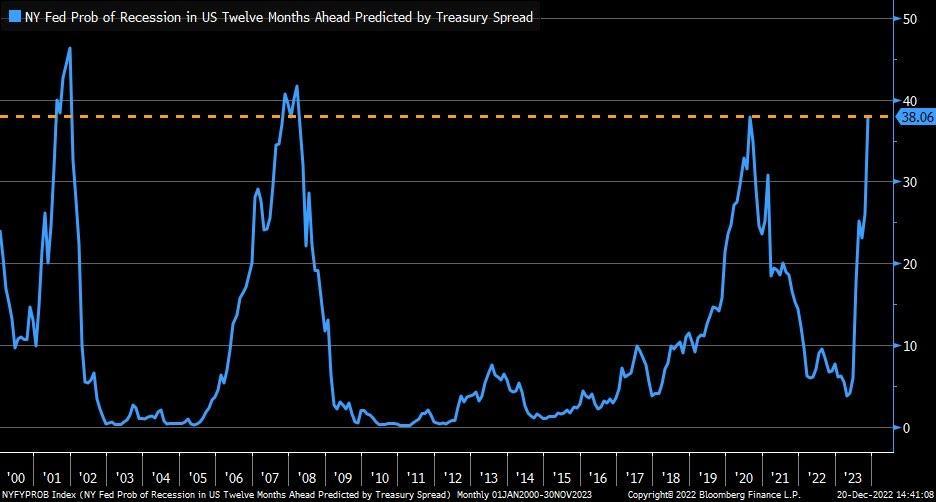
In terms of recession probabilities, we are now above the 2020 Covid highs, and fast approaching 2008 GFC and 2001 Dot.com levels.
Source: Bloomberg, NY Fed
Wave 5s across markets
A stickier inflation trajectory and a blinkered Fed will set us up next year for the final Wave 5 sell-off across all major asset classes.
We believe that markets are still unprepared for a break of this year’s extreme levels on the downside.
Below we show 5 highly correlated risk assets that look poised to begin their respective impulsive Wave 5 extensions higher/lower:
NASDAQ – Wave 5 Lower
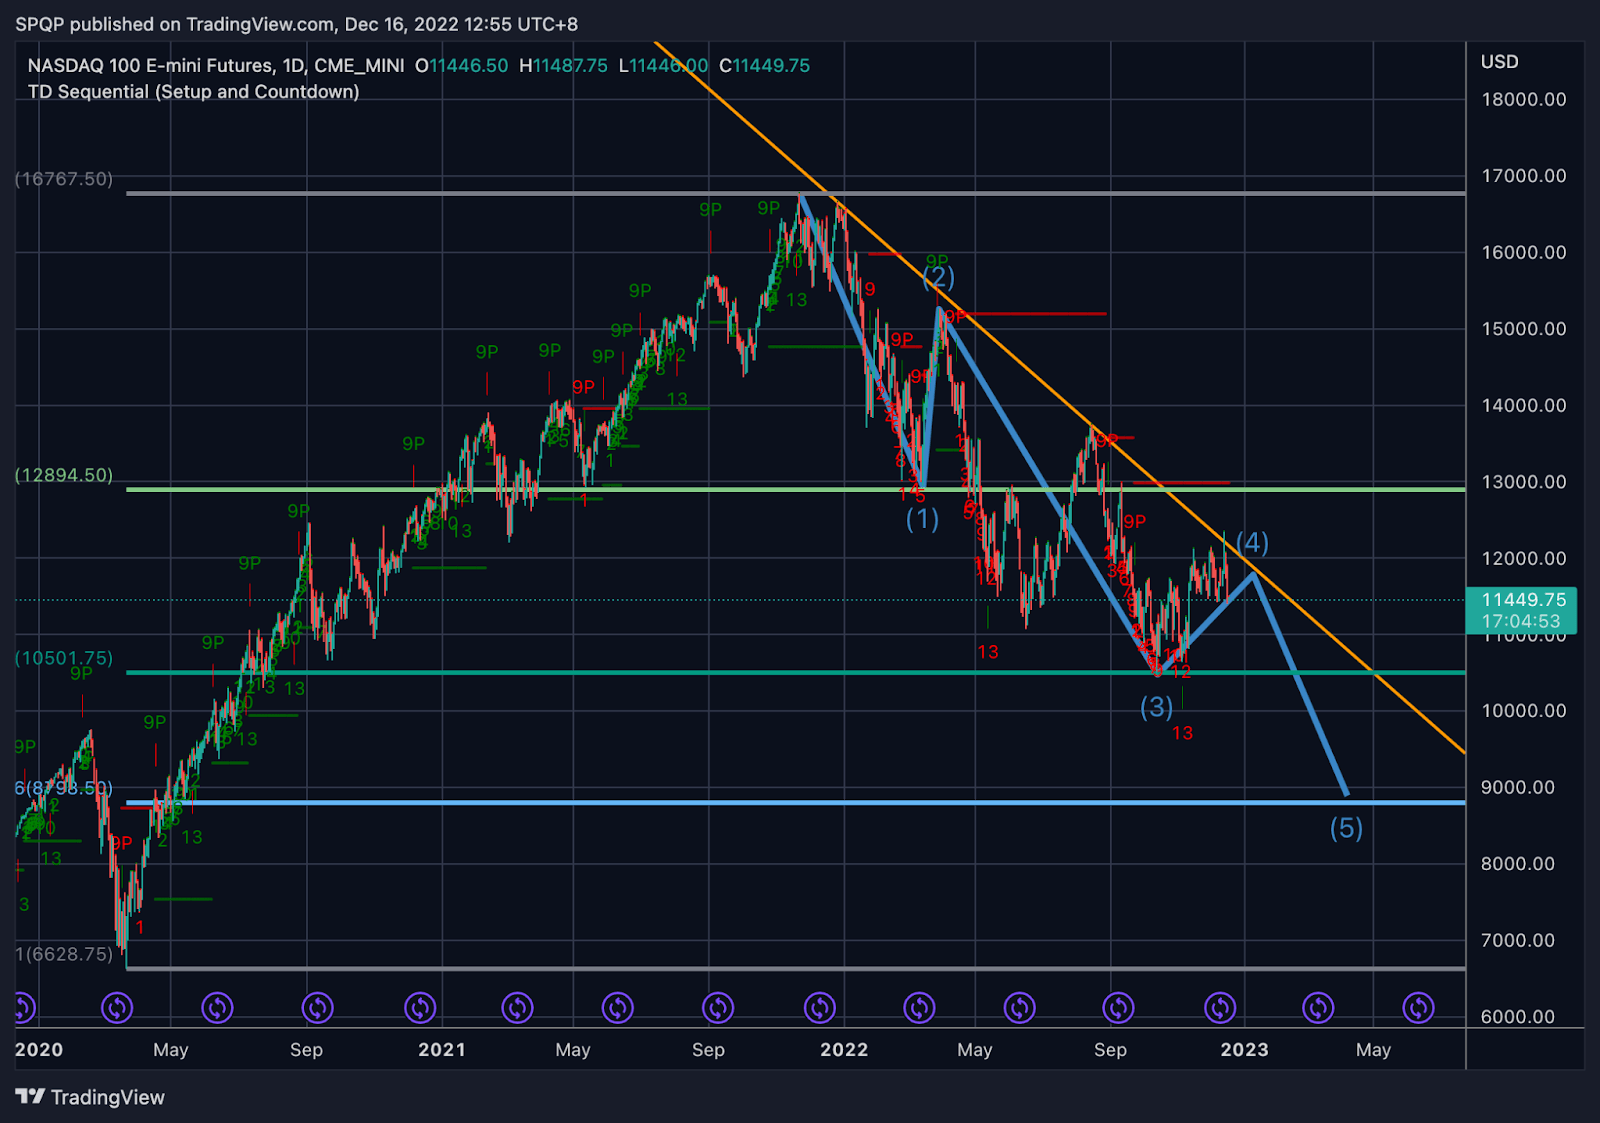
For NASDAQ, we are still unable to break above the trendline that has held throughout the decline since Dec 2021.
12,000 is a key level to the topside that needs to break to reduce any near-term bearish pressures.
An unexpected break above 13,000 will be the pivot for us to change our thesis.
On the downside it is likely that Wave 5 takes us below 10,000, with even a tail risk of a retest of Covid lows at 7,000.
The 78.6% Fibonacci of last resort is a sensible target for this bear market to end at 8800.
Source: Bloomberg, NY Fed
US 10-year yield – Wave 5 Higher
Source: Bloomberg, NY Fed
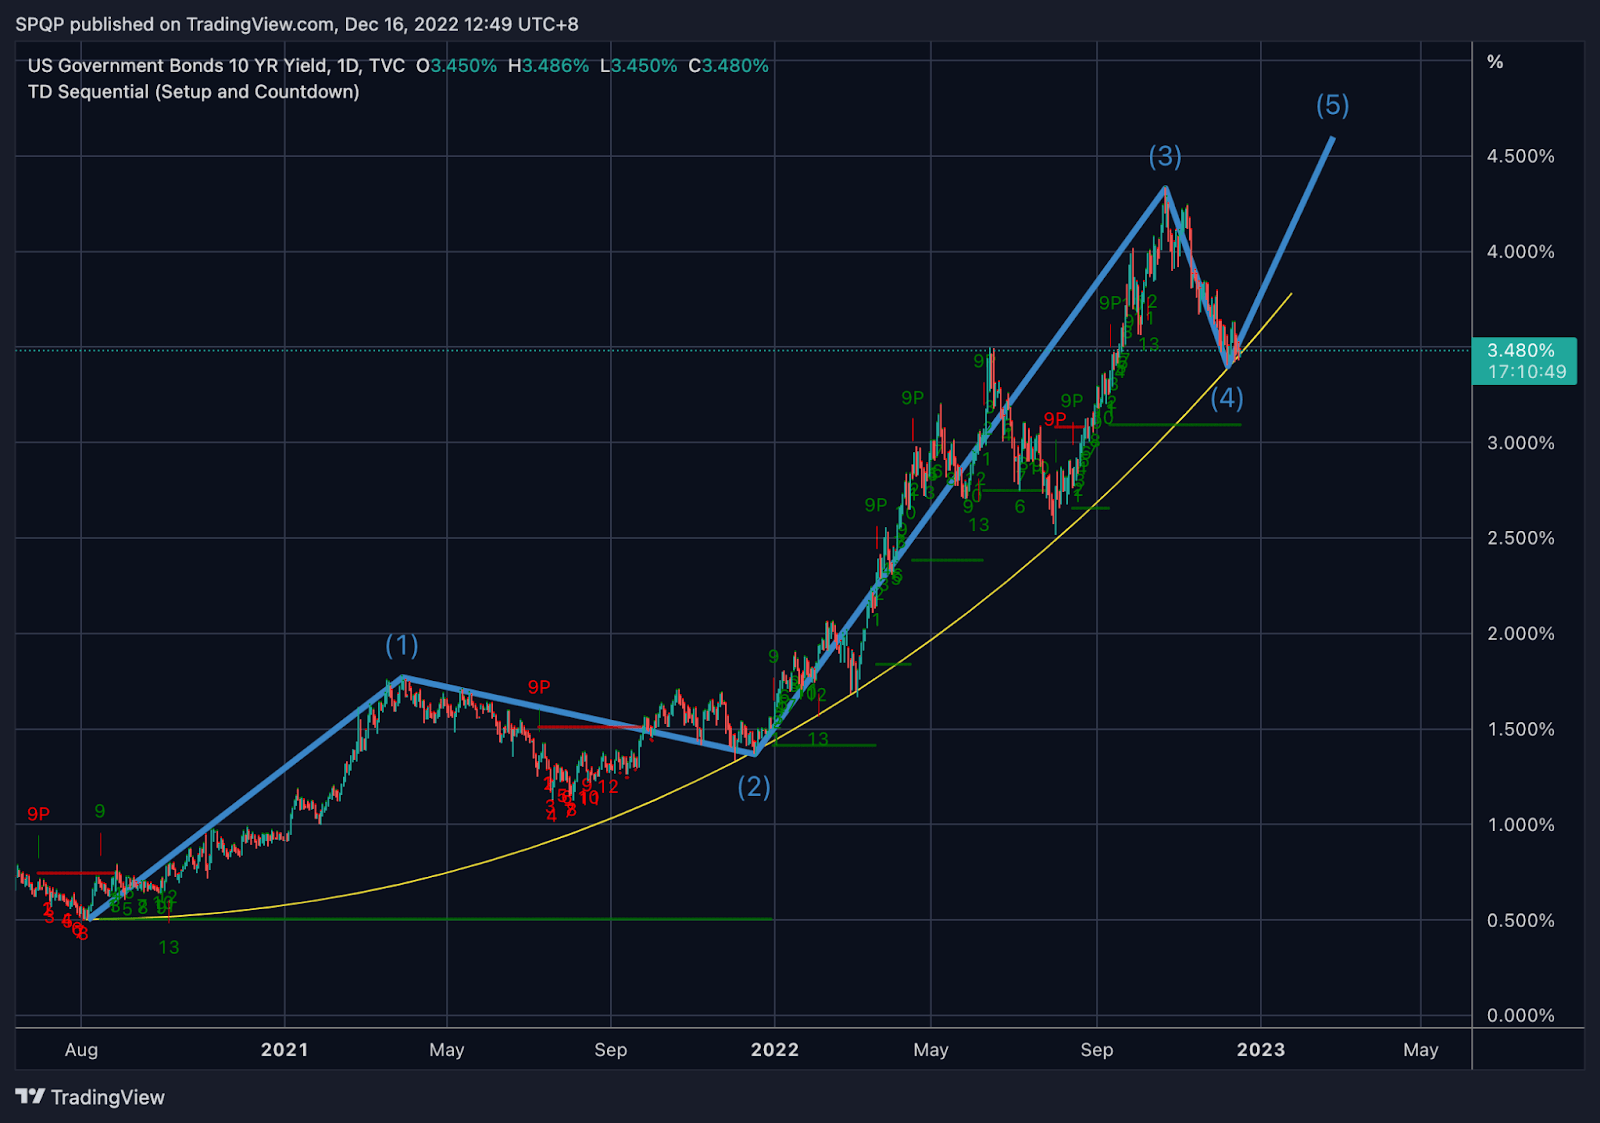
10-year yields have been holding its parabolic trendline, supporting the rally in yields all the way from 0.5% in Aug 2020, to a high of 4.3% in October this year.
It is the retracement in yields since the top in October that has driven this cross-asset risk rally.
An uptick in 10-year yields, coupled with a bear flattening in the 2s10s curve would be bearish for risk assets and bullish for the USD – as it would imply the market is catching up to the Fed’s hawkish terminal rate forecast of 5.5% for next year.
US Dollar (DXY) – Wave 5 Higher

USD Index has retraced significantly, falling 10% in just 6 weeks.
This sharp retracement has the hallmarks of a textbook Elliott wave alternating Wave 2 and 4 – with Wave 2 in 2020 being long-drawn, while this Wave 4 is short but sharp.
Hence, we expect a Wave 5 that would be similar in magnitude to Wave 1. That would be a ~16% rally from here that takes us to 120 on the DXY.
ETH – Wave 5 Lower
Ethereum (ETH) also played out a textbook triangle ABCDE Wave 4 correction, and looks poised to continue its bear market selloff in Wave 5.
Levels to watch are 1600 on the topside, which would negate immediate bearish pressure. A close above 2000 on a weekly basis will force us to reconsider our bear thesis.
On the downside 1000 followed by 800 are key.
We recommend selling near-dated 1600 calls, and longer dated 2000 calls; along with physically settled near-date 1000 puts and longer dated 800 puts.

BTC – Wave 5 Lower

BTC is trading in lock-step with ETH, although its own Wave 4 – a falling wedge implies more bearish pressure than ETH itself.
We continue to expect any large rallies in BTC to meet significant selling pressure.
The way we will be trading BTC is by selling 20,000 calls and rallies in spot.

An interesting relationship between ARKK (blue line) and BTC (orange line) implies further downside for BTC to come.
ARKK price action is leading BTC by 2 months, which forewarns of lower BTC prices to come.
ARKK was the poster child stock of the post-pandemic tech bubble era, and has been leading the tech rout on the way down as well.
And it has already embarked on its own Wave 5 lower, which has now taken it below its March 2020 lows!
Dot.com parallels
After the Dot.com bubble burst in 2001, fraud was uncovered in many of the tech firms – including behemoths like Enron and WorldCom, which to this day still ranks in the top 10 largest bankruptcies in US history.
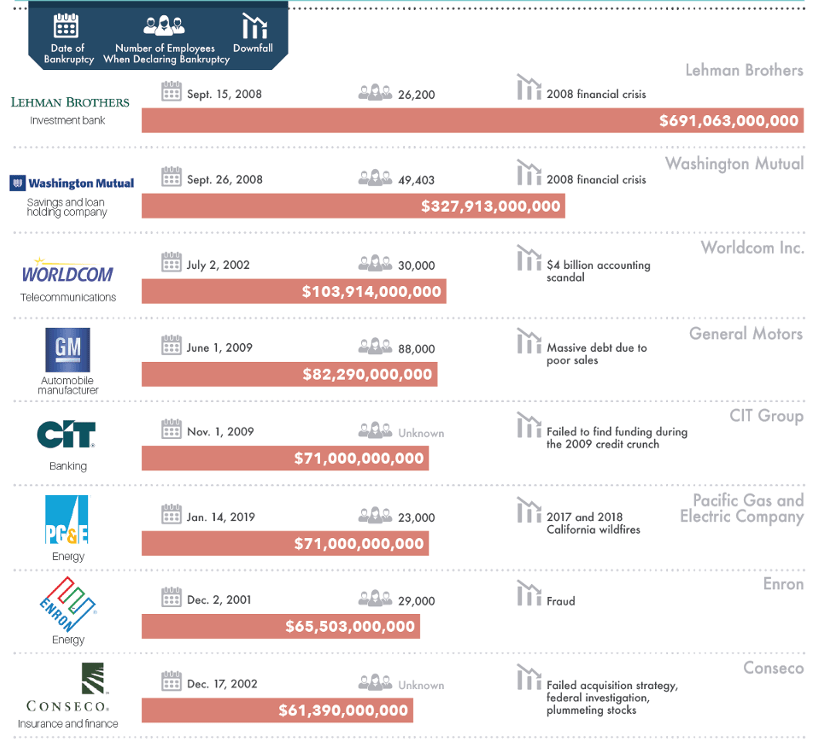
During boom times, much of this fraud goes unnoticed as investors are willing to pay high valuations when money is cheap. However, when liquidity gets withdrawn and the tide goes down, this is when many of these balance sheets come up naked.
What allowed bad actors to operate in the grey was the lack of definitive regulation. And while the wave of regulatory reform post-Enron stifled rapid business growth, it also set a strong foundation for stable returns in the years to come thereafter.
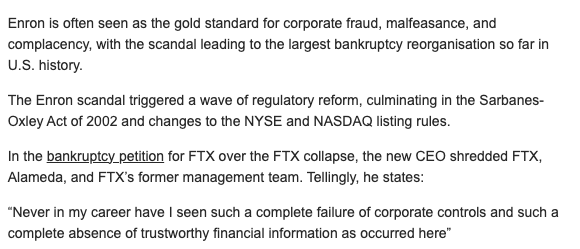
Source:UNSW news
Our DeFi analog is still tracking the Dot.com era perfectly. It goes to show the exponential growth we have ahead of us once regulation draws a sandbox by which all builders, investors and market participants can operate in, fairly and justly.

Source: QCP Insights, Bloomberg, DefiLlama
In summary
- Although we are past peak inflation, we now expect inflation to remain stickier than most have forecasted, and crucially to hold significantly above the Fed’s 2% target. This implies that the Fed will indeed be hiking rates 4-5 more times to their 5.5% forecast and hold it there until Q4 2023.
- The world’s growth will not be able to withstand these extreme rates, and this generation will see a stagflationary environment for the first time in the developed world – even if the recession proves a mild one in comparison to the 1970s.
- This means that our trading base case from last year is now imminent – a final “Wave 5” sell-off to come following this recent Q4 “Wave 4” recovery. This upcoming Wave 5 will be long and painful across all asset classes and will likely last until Q3 2023, breaking new lows in the process.
- Finally, the immediate aftermath of the Dot.com bust also unveiled multiple fraud cases like Enron and WorldCom, which remain some of the largest bankruptcies to this day. Similarly, in the crypto bust of 2022 we are now seeing such cases surface as well.
- Parallels to 2001 imply that forthcoming regulations aimed at tackling these gross negligences will weed out potential bad actors, setting the standards for the industry to regain trust and prevent such recurrences for a long time to come.
Disclaimer: QCP Capital is an exempt payment services provider pending licensing by the Monetary Authority of Singapore as an MPI for Digital Payment Token Services under the Payment Services Act (2019). This information contained in this document is intended as a general introduction to QCP Capital and its activities as a Digital Payment Token (DPT) service provider and is for informational purposes only. QCP Capital is not acting and does not purport to act in any way as an advisor or in a fiduciary capacity vis-a-vis any counterparty. Therefore, it is strongly suggested that any prospective counterparty obtain independent advice in relation to any trading investment, financial, legal, tax, accounting or regulatory issues discussed herein. This document is only directed at informed and qualified investors. By reading this material attests that you are fully aware that trading of DPTs is not suitable for the general public and that you are an informed and qualified investor, and are also fully cognisant of all technological and financial risk(s) associated with trading Digital Payment Tokens. Before you engage us or any of our services, you should be aware of the following: QCP Capital is an exempt payment services provider pending licensing by the Monetary Authority of Singapore as an MPI for Digital Payment Token Services under the Payment Services Act (2019). Please note that this does not mean you will be able to recover all the money or DPTs you paid to your DPT service provider if your DPT Service Provider’s business fails. You should be aware that the value of DPTs may fluctuate greatly. You should buy DPTs only if you are prepared to accept the risk of losing all of the money you put into such tokens. You should not transact in the DPT if you are not familiar with this DPT. This includes how the DPT is created, and how the DPT you intend to transact is transferred or held by your DPT service provider. You should be aware that your DPT service provider, as part of its licence to provide DPT services, may offer services related to DPTs which are promoted as having a stable value, commonly known as “stablecoin”.


 Bitcoin
  Ethereum
  Tether
  USDC
USDC  TRON
TRON  Dogecoin
  Cardano
  Bitcoin Cash
  Chainlink
  LEO Token
  Monero
  Stellar
  Zcash
Zcash  Litecoin
  Hedera
  Dai
Dai  Cronos
  Tether Gold
  OKB
OKB  Ethereum Classic
  KuCoin
  Gate
Gate  Algorand
  Cosmos Hub
  VeChain
  Dash
Dash  Tezos
Tezos  TrueUSD
  Stacks
  IOTA
IOTA  Basic Attention
  Decred
  Theta Network
  NEO
NEO  Qtum
Qtum  Synthetix
  Ravencoin
  0x Protocol
  DigiByte
  Zilliqa
  Nano
Nano  Holo
Holo  Numeraire
  Siacoin
  Waves
Waves  Status
  Ontology
  BUSD
BUSD  Enjin Coin
  Pax Dollar
  Hive
Hive  Lisk
Lisk  Steem
Steem  Huobi
Huobi  NEM
NEM  OMG Network
  Bitcoin Gold
  Augur
Augur  Ren
Ren