LINK Price Analysis: Bull Move Expected After Double Bottom?

- The link token is currently moving in a sideways trend.
- RSI indicator generates a buy signal for token.
- A double bottom formation may be considered as a base for a bull rally ahead.
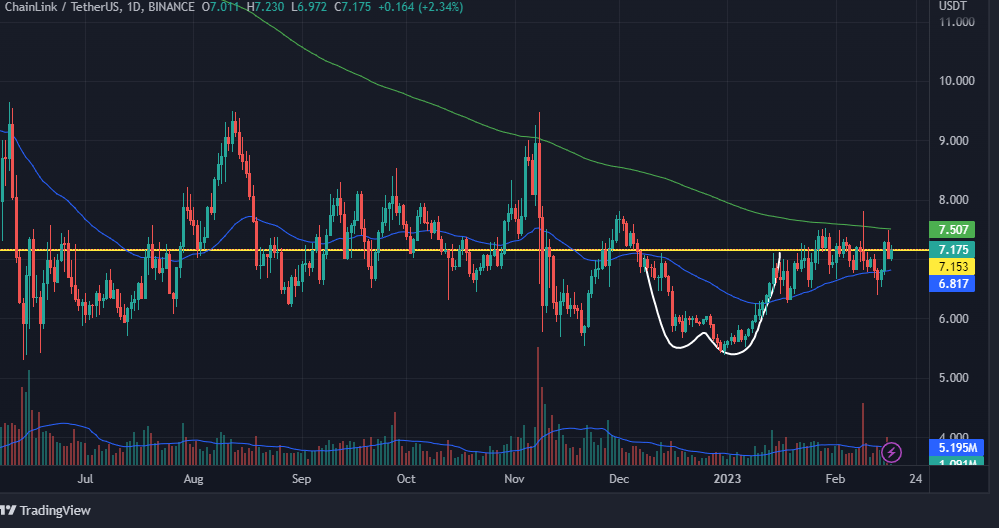
On a daily chart, Technical analysts might have noticed a formation of a double bottom pattern. After a double bottom pattern’s breakout, a bull move is anticipated. Moreover, it is also clearly visible that token has been moving sideways for a considerable amount of time.
What’s Next after a Consolidation Zone on a daily chart?

Source -LINK/USDT by Trading View
Investors may have observed on a daily chart that price of a token is presently consolidating in a zone before a double bottom pattern breakout. This consolidation may be considered as a positive signal because after this consolidation zone, a move that may occur on upside might be a strong bull move. Moreover, a Golden Crossover may also be seen on a chart as price of token rises.
Apart from this, it is also clearly visible that token gave a double bottom pattern breakout earlier as well.

Source -LINK/USDT by Trading View
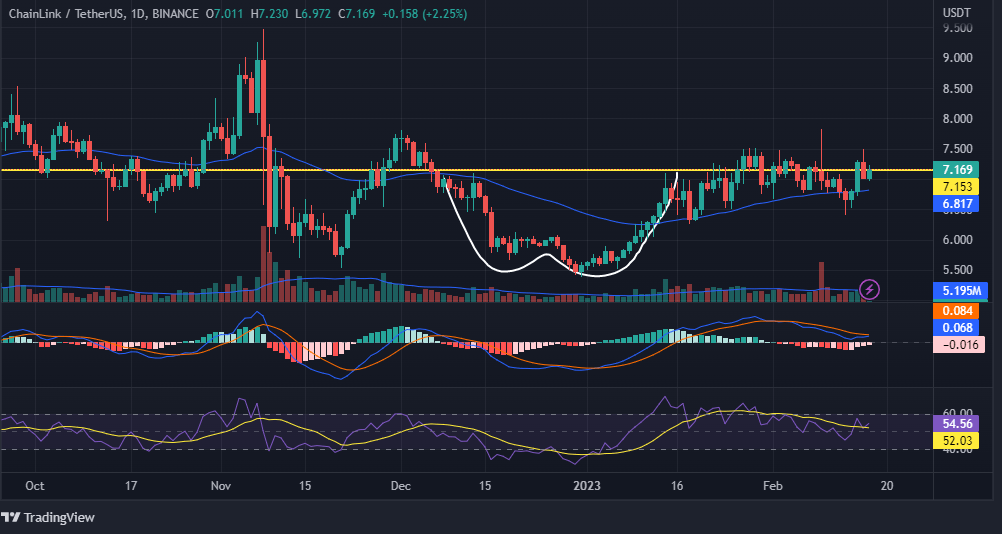
The MACD indicator earlier showed a bearish crossover which indicated that bears took control over bulls but now, at a present time, MACD indicator is on a verge of giving a bullish crossover. An increase in prices may be seen after this bullish crossover.The RSI curve, on other hand, is trading over its 50-point threshold at 54.56. Once price of a token increases, RSI curve’s value may be observed increasing.
Overall, MACD is currently neutral whereas RSI indicator is delivering a buy signal.
Is token on a verge of showing a bull move?

Source -LINK/USDT by Trading View
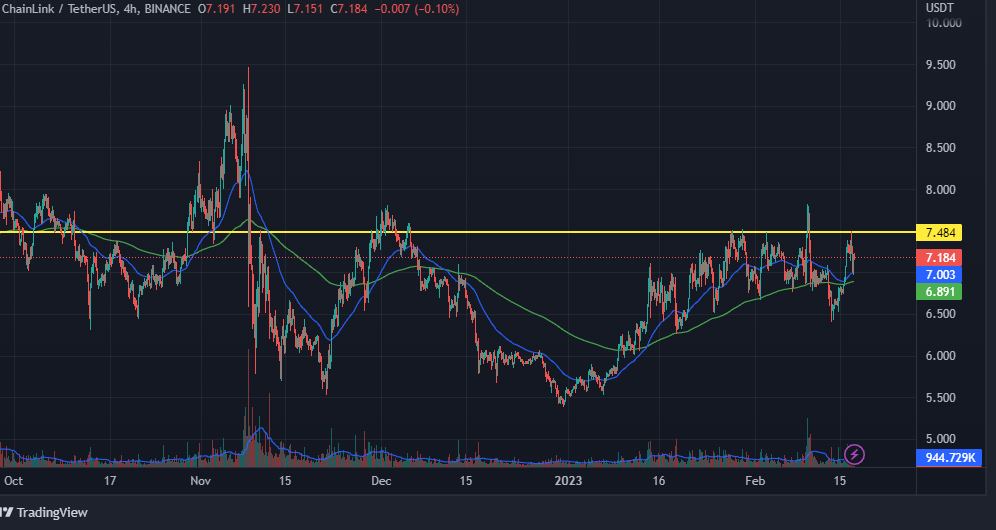
On a short-term chart, it is visible that token is moving sideways and is currently facing resistance around $7.484. The Link token has tried to break this resistance multiple times but has not gained success. Therefore, an increase in prices of a token this time above a resistance, may lead to a bull rally. Apart from this, a Golden Crossover previously occurred on a short-term chart which led to increase in prices from support levels to current levels.
Conclusion
Investors may have come to a conclusion after examining both on a short-term and daily charts that token may continue to consolidate for a little time at current price levels, but after crossing a resistance and delivering a double bottom pattern breakout, a sharp bull move may occur.
Technical Levels
Resistance levels – $7.484 and $9.476
Support levels – $6.543 and $5.743
Disclaimer: The views and opinions stated by an author, or any people named in this article, are for informational purposes only, and may not establish financial, investment, or any other financial advice. Investing in or trading crypto assets comes with a risk of financial loss.


 Bitcoin
  Ethereum
  Tether
  USDC
USDC  Dogecoin
  TRON
TRON  Cardano
  Chainlink
  Stellar
  Bitcoin Cash
  LEO Token
  Hedera
  Litecoin
  Monero
  Dai
Dai  Cronos
  OKB
OKB  Ethereum Classic
  Gate
Gate  VeChain
  Cosmos Hub
  Algorand
  KuCoin
  Stacks
  Maker
Maker  Zcash
Zcash  Tether Gold
  Theta Network
  IOTA
IOTA  Tezos
Tezos  TrueUSD
  NEO
NEO  Polygon
  Dash
Dash  Decred
  Synthetix Network
  Zilliqa
  Qtum
Qtum  0x Protocol
  Basic Attention
  Siacoin
  Holo
Holo  Ravencoin
  DigiByte
  Enjin Coin
  Status
  Nano
Nano  Ontology
  Hive
Hive  Waves
Waves  Lisk
Lisk  Pax Dollar
  Steem
Steem  Numeraire
  NEM
NEM  BUSD
BUSD  Huobi
Huobi  OMG Network
  Bitcoin Gold
  Ren
Ren  Augur
Augur  Bitcoin Diamond
  HUSD
HUSD