Here Are 3 Scenarios for Cardano, As ADA Reaches Pivotal Price Levels

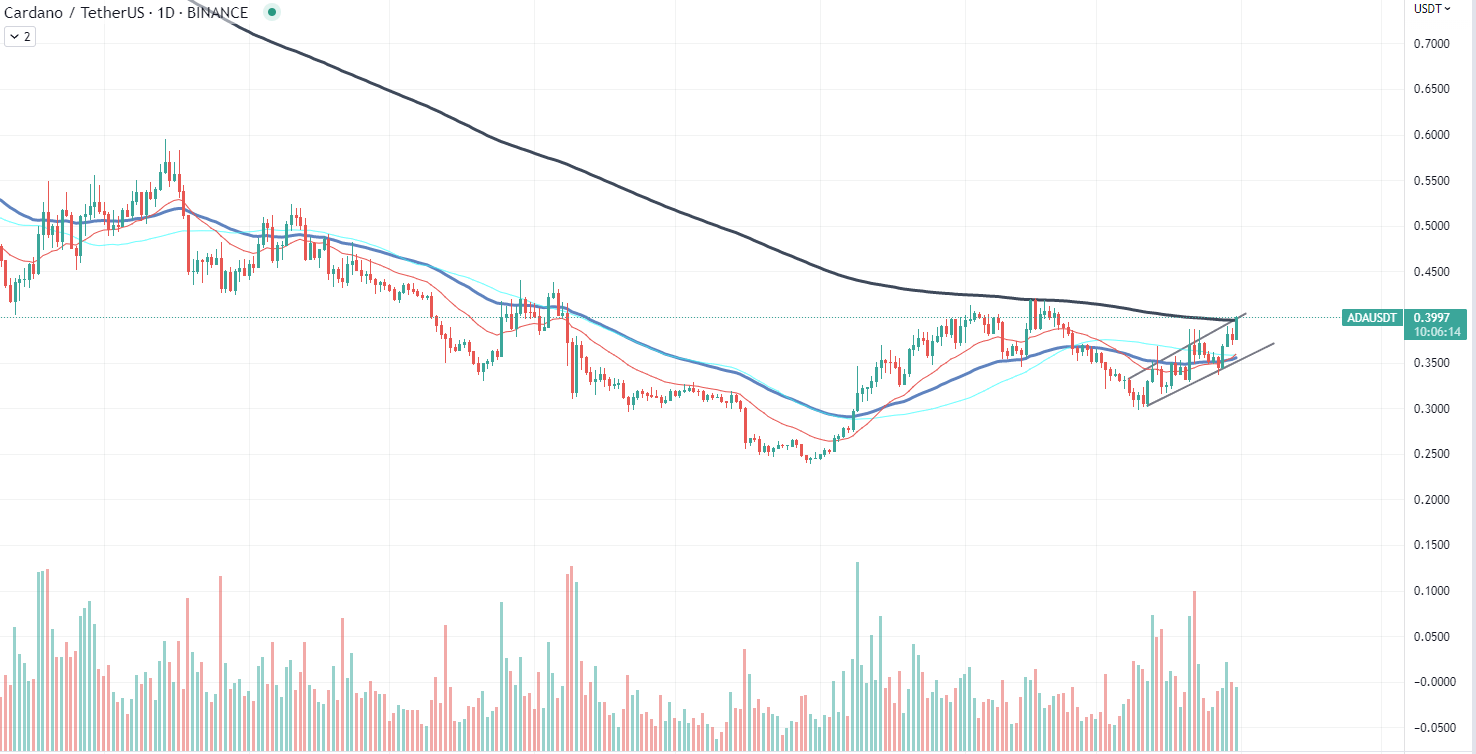
Cardano (ADA) has experienced a notable price increase since March 19, pushing the cryptocurrency toward several pivotal price thresholds. In this article, we will discuss three key levels ADA needs to reach and sustain, which could signal a more substantial bullish trend in the near future.
Firstly, ADA’s reversal from the 200-day moving average is a crucial milestone to watch. The 200-day moving average serves as a long-term trend indicator, and a successful reversal from this level would signal a positive shift in momentum.

Second, a breakout above the 200-day exponential moving average (EMA) is another significant price level to observe. Currently, the 200-day EMA is hovering around the $0.41 mark, which also acts as a critical resistance level for ADA. If the cryptocurrency can successfully break through this barrier, it may pave the way for further upside movement.
Lastly, the third pivotal price threshold for ADA involves a successful breakout and sustained consolidation above the $0.41 resistance level. Consolidating above this level would indicate that buyers have taken control of the market, and ADA could potentially move toward even higher price targets in the future.
Shiba Inu forms triangle
Shiba Inu (SHIB) recently formed a symmetrical triangle pattern on its trading chart, a development that has captured the attention of market participants. This pattern has emerged as the volatility of the SHIB trading pair has decreased, reaching local lows.
A symmetrical triangle pattern typically consists of two converging trendlines, one ascending and the other descending, which meet at a point referred to as the apex. This formation often indicates a period of consolidation, where buying and selling pressures are roughly equal, and the market is awaiting a catalyst to spark the next significant price movement. The pattern’s narrowing range causes the trading volume to decrease, compressing the price action within the triangle.
As the symmetrical triangle pattern progresses, the potential energy within the market builds up, eventually leading to a breakout or breakdown in price once the pattern reaches its apex.
A breakout above the descending trendline may signal the start of a bullish trend, while a breakdown below the ascending trendline could indicate further price depreciation. It is important to note that the direction of a breakout or breakdown is often unpredictable, so traders should exercise caution when making decisions based on this pattern.
Arbitrum whales are turning the tide
The Arbitrum (ARB) network has recently seen a reversal in its price trajectory, with a notable increase in active profit-taking among investors. This comes after the token’s price spiked to $1.4, prompting a significant number of market participants to cash in on their gains.
Despite the recent price spike, the average token sale price has remained relatively stable for both early and late airdrop recipients. This suggests that a broad range of investors has been cashing in on their profits, regardless of when they entered the market. However, a key driver of the current reversal appears to be the actions of whale investors, who exert considerable selling pressure on the market.
The heightened selling pressure from ARB whales could lead to a more substantial price decline, particularly if other market participants follow suit and begin to sell off their holdings.


 Bitcoin
  Ethereum
  Tether
  USDC
USDC  TRON
TRON  Dogecoin
  Cardano
  Bitcoin Cash
  Chainlink
  Monero
  LEO Token
  Zcash
Zcash  Stellar
  Litecoin
  Hedera
  Dai
Dai  Cronos
  Tether Gold
  OKB
OKB  Ethereum Classic
  KuCoin
  Gate
Gate  Algorand
  Cosmos Hub
  VeChain
  Dash
Dash  TrueUSD
  Tezos
Tezos  Stacks
  IOTA
IOTA  Basic Attention
  Decred
  Theta Network
  NEO
NEO  Synthetix
  Qtum
Qtum  Ravencoin
  0x Protocol
  DigiByte
  Nano
Nano  Zilliqa
  Siacoin
  Numeraire
  Waves
Waves  BUSD
BUSD  Status
  Enjin Coin
  Pax Dollar
  Ontology
  Hive
Hive  Lisk
Lisk  Steem
Steem  Huobi
Huobi  NEM
NEM  OMG Network
  Bitcoin Gold
  Augur
Augur  Ren
Ren  HUSD
HUSD