ADA Bulls Buck Bearish Trends, Eyes Set on Breaching Resistance

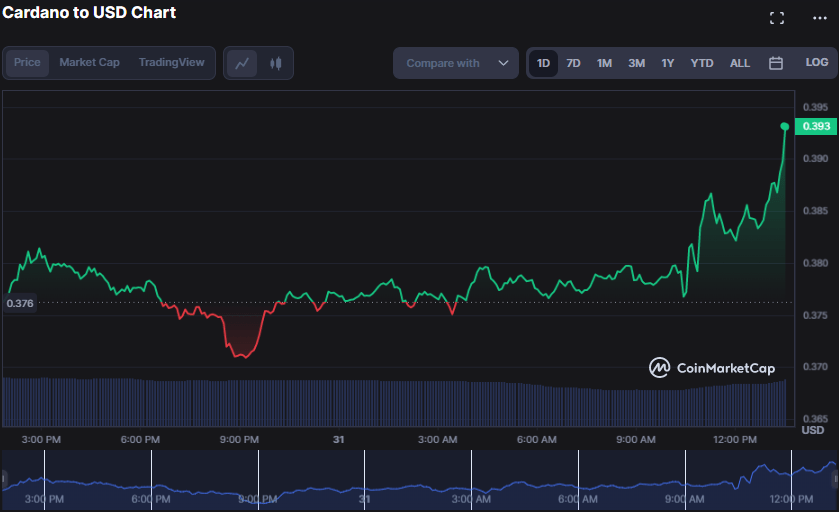
Despite the bear’s attempts to buck the trend, Cardano (ADA) bulls have had the most market control in the last 24 hours. During the bull run, the support and resistance levels were $0.3709 and $0.39, representing the “buy” and “sell” zones, respectively. As of press time, the bullish power was still strong, with ADA trading at $0.3898, a 3.03% increase, and showing signs of further upward movement.
If this bullish power continues and breaks the $0.39 resistance, the next resistance levels may be at $0.40 and $0.42, which could attract more buyers and further increase ADA’s value. However, if the bears gain control, the support levels at $0.3709 and $0.35 may come into play.
While the market capitalization rises by 3.25% to $13,571,695,638, the 24-hour trading volume falls by 4.36% to $396,835,225. This move suggests that the bullish momentum is fading and that the market may enter a period of consolidation before the next big move.

ADA/USD 24-hour price chart (source: CoinMarketCap)
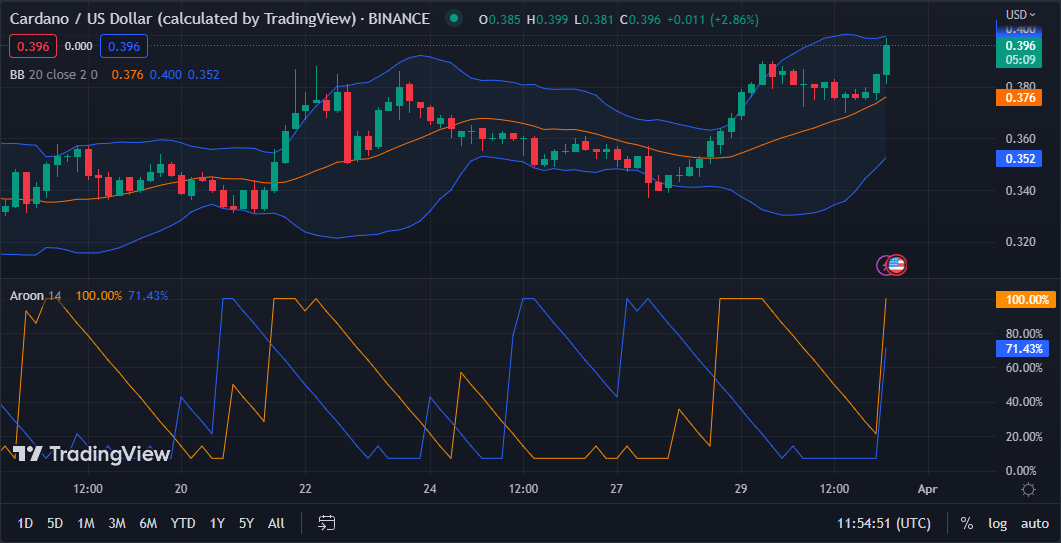
The positive momentum in ADA is expected to continue soon as the Bollinger bands broaden as the market continues north. This movement shows that traders might consider investing in ADA in anticipation of additional price gains. The top bar hits 0.399, while the lower bar touches 0.353, demonstrating bullish momentum.
The Aroon up reading of 100.00% and the Aroon down reading of 71.43% indicates that ADA is in a strong uptrend and that purchasing pressure will likely continue. This trend, however, implies that traders should be careful and utilize stop-loss orders to protect themselves from any rapid market swings that might result in a price decline.

ADA/USD chart (source: TradingView)
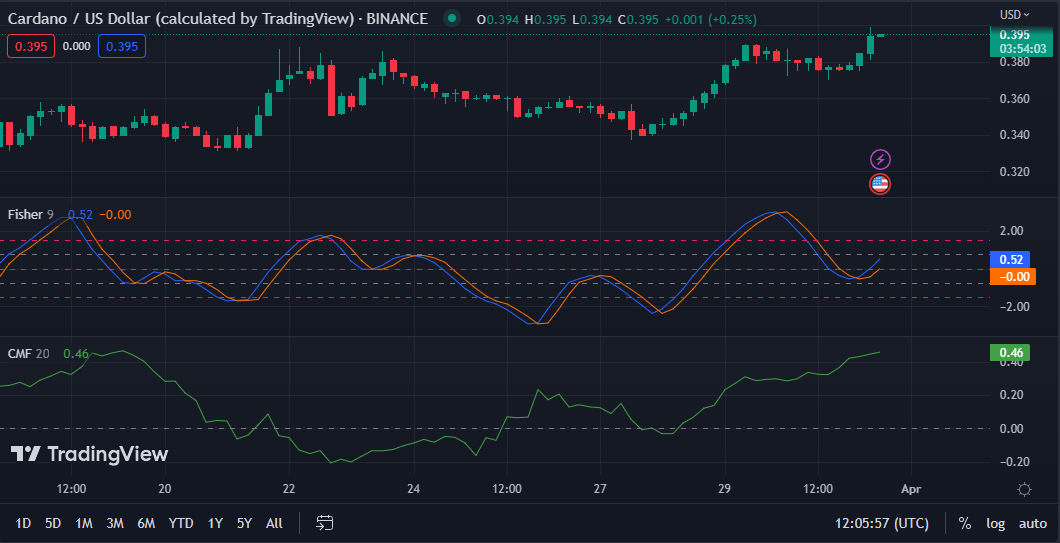
The Chaikin Money Flow (CMF) motion north, with a reading of 0.46, suggests that the bullish momentum in ADA may continue because money is flowing into the market. This move boosts traders’ confidence in the ADA market and may entice more investors to join the bullish trend, potentially driving up the price even further.
A Fisher Transform reading of 0.52 and moving above its signal line confirms the bullish sentiment in the ADA market, indicating a potential buying opportunity for traders looking to capitalize on the upward trend.
If it falls below its signal line, it may indicate a shift toward bearish sentiment, and traders may want to consider taking profits or cutting losses.

ADA/USD chart (source: TradingView)
ADA bulls show strength, pushing past resistance levels. Traders should utilize stop-loss orders & watch for potential market swings as momentum continues.
Disclaimer: The views, opinions, and information shared in this price prediction are published in good faith. Readers must do their research and due diligence. Any action taken by the reader is strictly at their own risk. Coin Edition and its affiliates will not be liable for direct or indirect damage or loss.


 Bitcoin
  Ethereum
  Tether
  USDC
USDC  TRON
TRON  Dogecoin
  Cardano
  Bitcoin Cash
  Chainlink
  Zcash
Zcash  Monero
  LEO Token
  Stellar
  Litecoin
  Hedera
  Dai
Dai  Cronos
  Tether Gold
  OKB
OKB  Ethereum Classic
  KuCoin
  Gate
Gate  Algorand
  Cosmos Hub
  VeChain
  Dash
Dash  Tezos
Tezos  TrueUSD
  Stacks
  IOTA
IOTA  Decred
  Basic Attention
  Theta Network
  NEO
NEO  Synthetix
  Qtum
Qtum  Ravencoin
  DigiByte
  0x Protocol
  Nano
Nano  Zilliqa
  Siacoin
  Numeraire
  Waves
Waves  Ontology
  Status
  BUSD
BUSD  Enjin Coin
  Pax Dollar
  Hive
Hive  Lisk
Lisk  Steem
Steem  Huobi
Huobi  OMG Network
  NEM
NEM  Bitcoin Gold
  Augur
Augur  HUSD
HUSD