This Could Be The Next Target For Solana As Price Turns Bullish

The Solana price has experienced a significant uptrend in recent days, with SOL rising by almost 6% over the past week. However, in the last 24 hours, the altcoin has shown signs of consolidation. Continued consolidation could potentially cause it to lose its bullish momentum if it continues.
The technical outlook for Solana indicates that both bulls and bears are evenly matched due to the sideways movement on the daily chart. While buying strength has recovered, sellers still have the upper hand.
Related Reading: Dogecoin Price Forms A Falling Wedge Pattern, Can Price Touch $0.11?
The demand for SOL must increase in the immediate trading sessions, or accumulation may decline. Despite the indicators not fully favouring the bulls, SOL has the potential to rise above its immediate trading sessions if it remains above local support.
The SOL bulls must overcome two critical resistance levels for the price to continue rising. Broader market strength is also crucial for the asset. The market capitalization has also seen an uptick, indicating the presence of buyers in the market.
Solana Price Analysis: One-Day Chart

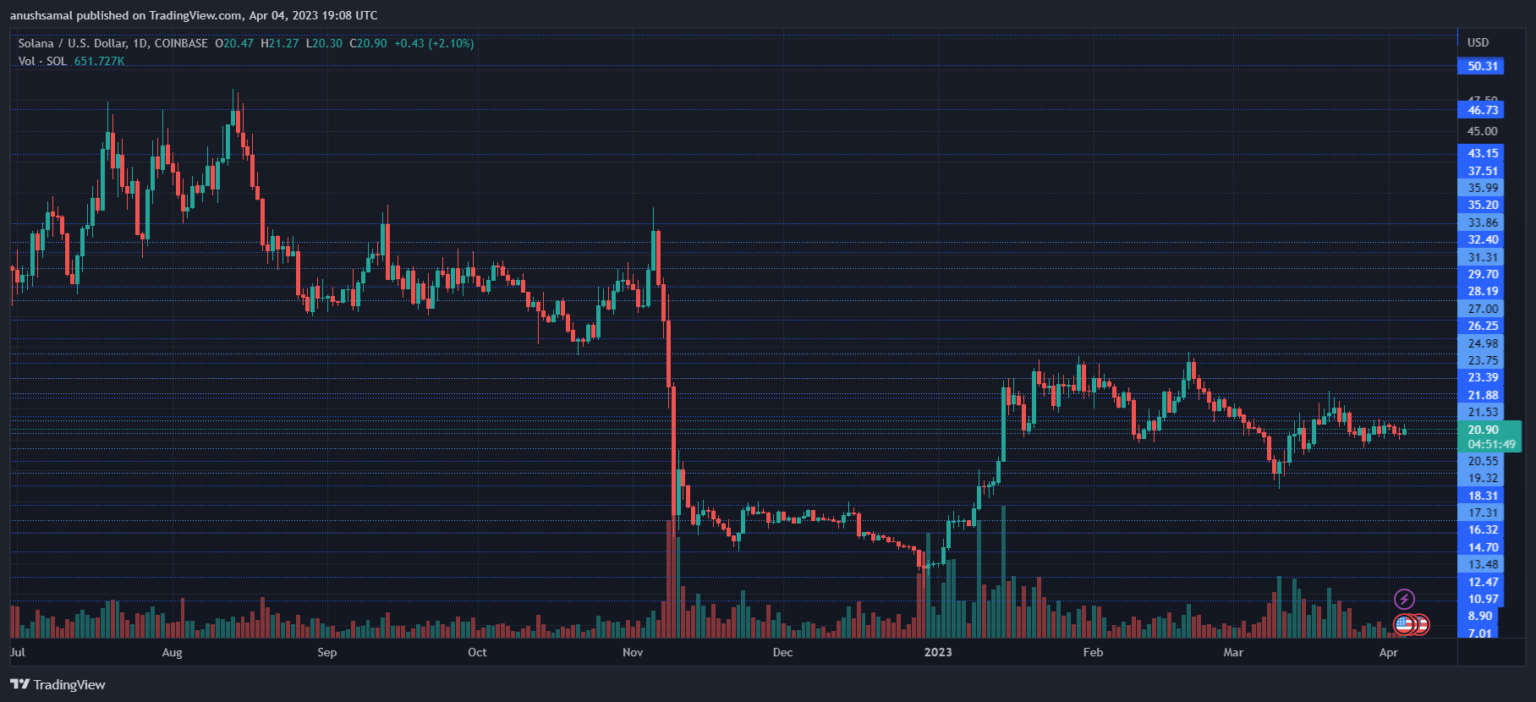
SOL was trading at $20.90 at the time of writing. The recent price appreciation allowed the bulls to break through a crucial resistance level and turn it into support. The overhead resistance for the altcoin was $21.50, and if breached, SOL could encounter another resistance at $23.40.
Successfully surpassing $23.40 could drive SOL to $26. Conversely, the first line of support for the altcoin was at $19.30, and failing to remain above it could cause SOL to trade close to the $18 mark. The amount of Solana traded in the last session turned green indicating an influx of buying strength on the one-day chart.
Technical Analysis

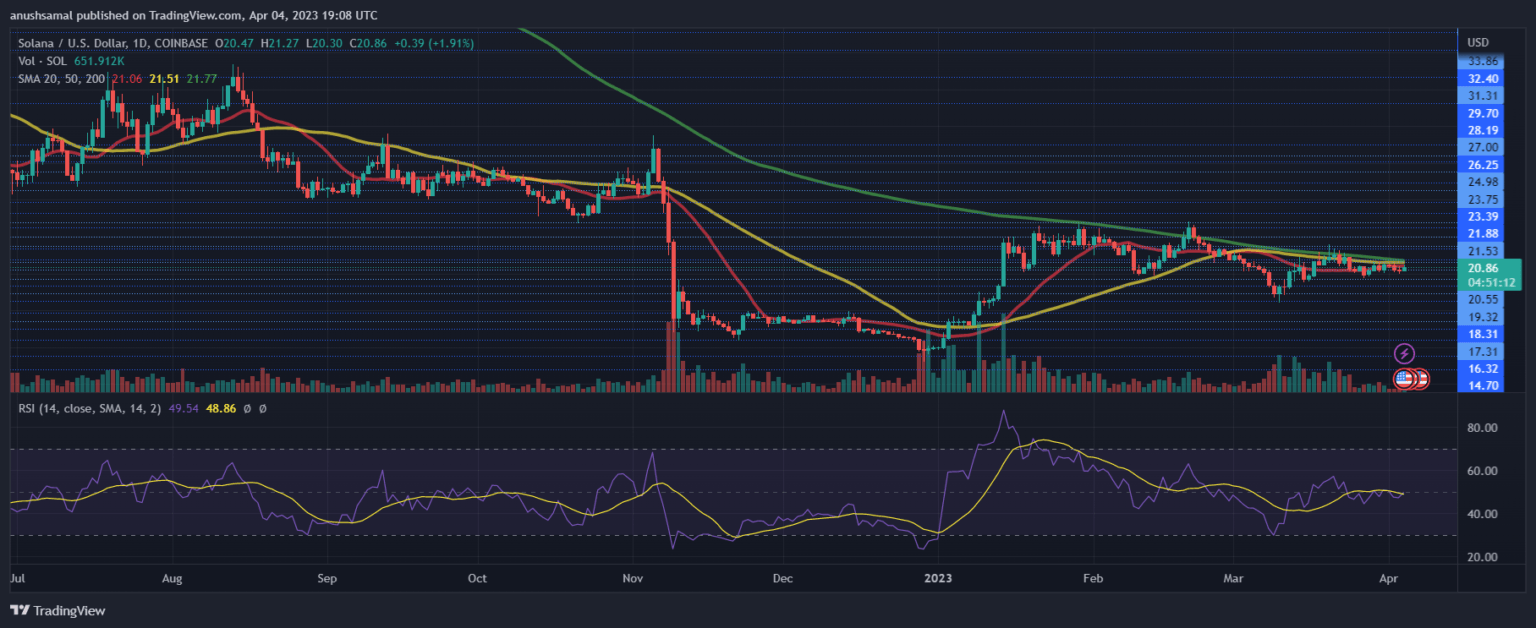
Although buyers were still trying to establish their position in the market, SOL was not entirely bullish. The Relative Strength Index showed a slight uptick but remained slightly below the half-line, indicating that there were more sellers than buyers.
Additionally, the price of SOL was below the 20-Simple Moving Average, indicating that demand was still low and sellers were driving the price momentum in the market.

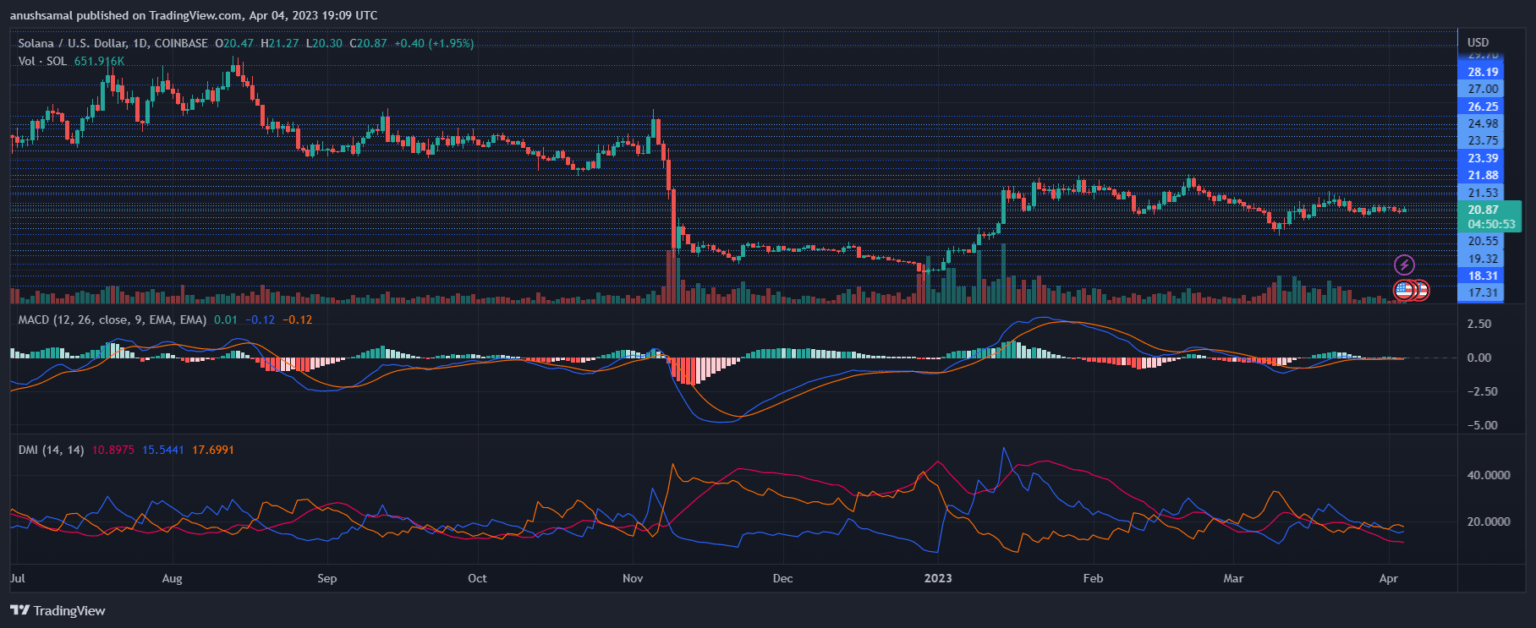
Due to the low demand for the altcoin, it displayed sell signals on the chart. The Moving Average Convergence Divergence indicator, which measures price momentum and reversals, began to show a red signal bar, indicating sell signals for the altcoin.
Related Reading: Here’s Why Bitcoin Could Break At Least $33,000 In This Rally
However, the price direction of SOL had not yet shown any significant change. The Directional Movement Index indicated a negative trend, with the -DI line (orange) above the +DI line (blue). Additionally, the Average Directional Index was red and below the 20-mark, indicating that the SOL price trend lacked significant strength.
Featured Image From UnSplash, Charts From TradingView.com


 Bitcoin
  Ethereum
  Tether
  USDC
USDC  Dogecoin
  TRON
TRON  Cardano
  Chainlink
  Bitcoin Cash
  Stellar
  LEO Token
  Hedera
  Litecoin
  Monero
  Dai
Dai  OKB
OKB  Cronos
  Ethereum Classic
  Gate
Gate  VeChain
  Cosmos Hub
  Algorand
  KuCoin
  Stacks
  Tether Gold
  Zcash
Zcash  Theta Network
  IOTA
IOTA  Tezos
Tezos  TrueUSD
  NEO
NEO  Ravencoin
  Polygon
  Dash
Dash  Decred
  Synthetix Network
  Zilliqa
  Qtum
Qtum  0x Protocol
  Basic Attention
  Siacoin
  Holo
Holo  DigiByte
  Enjin Coin
  Nano
Nano  Ontology
  Status
  Hive
Hive  Waves
Waves  Lisk
Lisk  Pax Dollar
  Steem
Steem  Numeraire
  BUSD
BUSD  NEM
NEM  Huobi
Huobi  OMG Network
  Bitcoin Gold
  Ren
Ren  Bitcoin Diamond
  Augur
Augur