WBTC Price Analysis: The price is taking a bearish turn?

- The price of WBTC is currently trading near $28983.0 where it is seeing a change of 66.44% in 24-hour trading volume.
- The WBTC price is observing a decline of 1.20% in the last 24 hours.
- Wrapped Bitcoin may take a bearish correction of 15%’
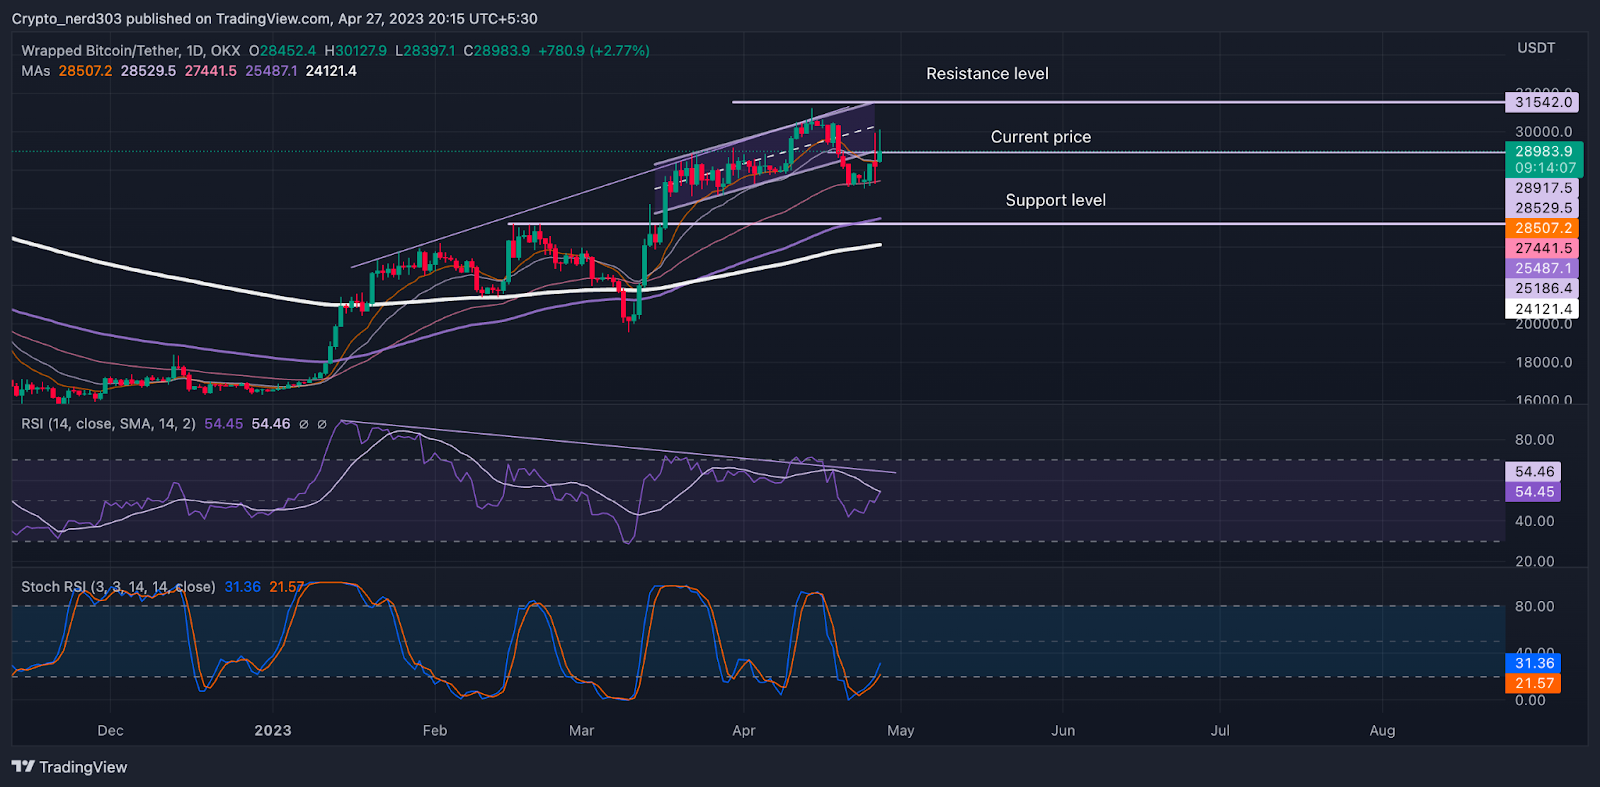
Recently, the price of WBTC broke its consolidation in the supply zone. Near early April the price gained buyers’ support around the price of $20,000 the WBTC token made an extremely bullish move gaining more than 42% of its value. It started trading under an ascending flag channel a bearish pattern. The price of WBTC is trading at $28983.0, there is a major increase in trading activity between buyers and sellers.
Presently, the sentiments of the investors are bullish regarding the price of WBTC on the daily timeframe. Though the price may take a bearish correction in the near future. The price recently broke ascending channel pattern at the supply zone and it is making a retest. This pattern is forecasting a bearish downturn.
WBTC price trading under the supply zone on the (Daily Timeframe)

Source: WBTC/USDT by TradingView
After the price broke above the major key EMA levels near early January gaining 42% in value. In late January the price started trading in the ascending channel after which took a retracement from 200. Followed by another rally the price is repeating the same pattern.
The making of this pattern suggests the price can take a correction in the near future. If the sellers take control from its recent resistance level it can lose 20% of its value within a week.
Technical Analysis ( 1 Day Timeframe )

Source: WBTC/USDT by TradingView
Presently the WBTC price is trading on an uptrend; the RSI line is making a lower high and lower low pattern. The making of RSI divergence is hinting towards the upcoming change in trend. The current RSI value is 54.45 points and it is taking resistance from the 14 SMA which is trending just above the RSI line, around 54.46 near the overbought level.
The stochastic RSI on the other hand is making a bullish reversal from oversold levels. The Stochestic RSI has recently crossed the 30 points mark and the %K line is giving the %D line a positive interception near 31 points.
Conclusion
According to the analysis, If the price fails to make a retest from the current levels, it can make a downfall of 15% in the near future. Its nearest support level is 100 EMA. The Stochestic RSI and RSI indicators are moving in contrast with each other hence the investors might wait for a strong move before making a decision.
Technical Levels:
Support -$25000.0
Resistance – $30000.0
Disclaimer
The views and opinions stated by the author, or any people named in this article, are for informational purposes only, and they do not establish financial, investment, or other advice. Investing in or trading crypto assets comes with a risk of financial loss.


 Bitcoin
  Ethereum
  Tether
  USDC
USDC  TRON
TRON  Dogecoin
  Cardano
  Bitcoin Cash
  Chainlink
  Monero
  LEO Token
  Zcash
Zcash  Stellar
  Litecoin
  Hedera
  Dai
Dai  Cronos
  Tether Gold
  OKB
OKB  Ethereum Classic
  KuCoin
  Gate
Gate  Algorand
  Cosmos Hub
  VeChain
  TrueUSD
  Dash
Dash  Tezos
Tezos  Stacks
  IOTA
IOTA  Basic Attention
  Theta Network
  Decred
  NEO
NEO  Synthetix
  Qtum
Qtum  Ravencoin
  DigiByte
  0x Protocol
  Nano
Nano  Zilliqa
  Holo
Holo  Siacoin
  Numeraire
  Waves
Waves  Status
  BUSD
BUSD  Enjin Coin
  Pax Dollar
  Ontology
  Hive
Hive  Lisk
Lisk  Steem
Steem  Huobi
Huobi  NEM
NEM  OMG Network
  Bitcoin Gold
  Augur
Augur  Ren
Ren  HUSD
HUSD