QNT Price Analysis: Will Bears Seize Control Back In QNT Price?

- 1 The QNT price is currently trading at $115.7 while seeing a change of 18% in 24-hour trading volume.
- 2 Quant is observing a decline of 0.075% in the last 7 days.
After making the predicted bullish rally from its previous support level, QNT price surged by 18% in the last 7 days. Though observing the present price action the QNT token is forecasting a substantial decline of its value within the near future. The price is at present trading below crucial 200 EMA and MA resistance levels on the daily time frame though it recently gave a positive breakout through all the faster-moving averages.
The current price of QNT is $115.7, its market capitalization saw a slight surge, and the present value is around $1.4 Billion ranked 35 from 5,223 cryptocurrencies.
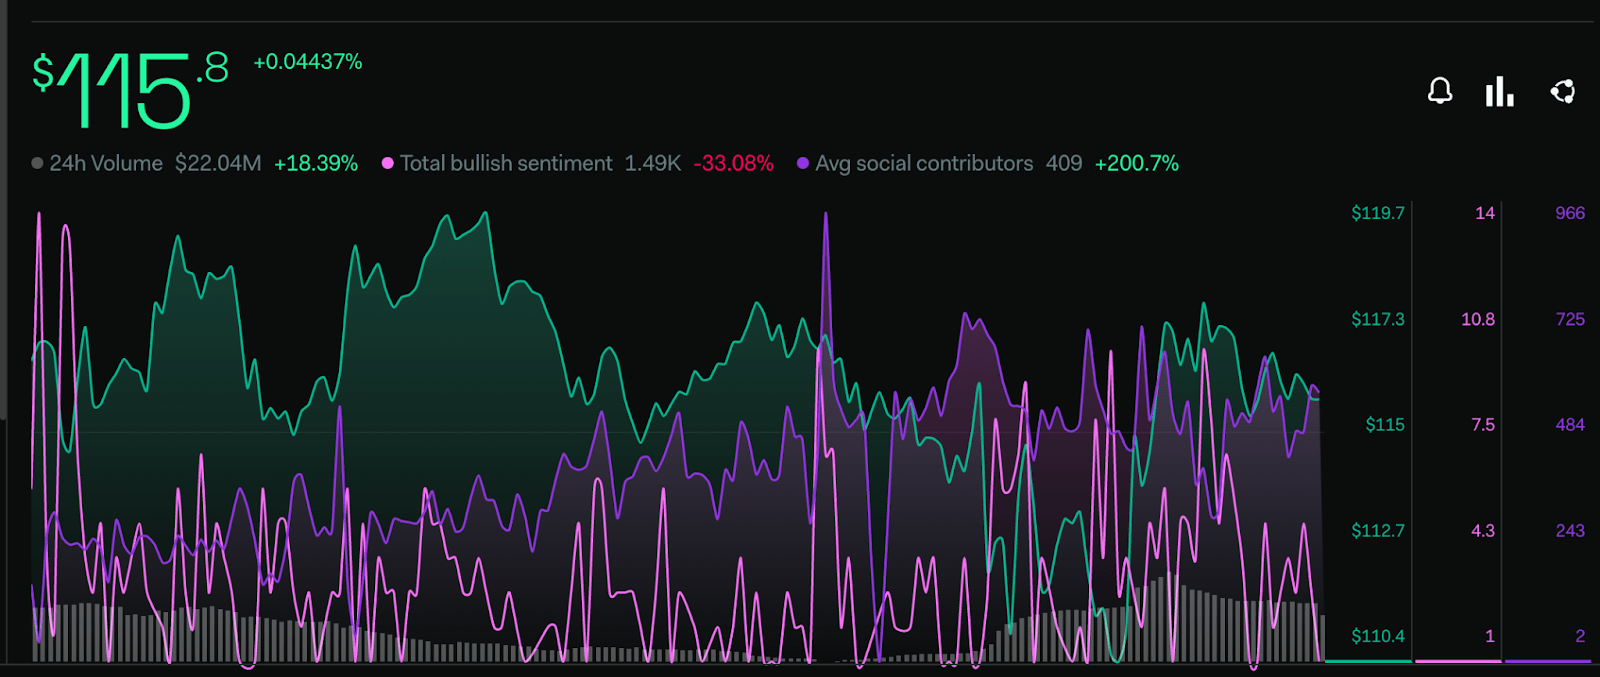
An Ominous Fall In Bullish Sentiments

Source: QNT/USDT by LunaCrush
Previously positive sentiments of the investors are taking a negative turn at present as per LunarCrush. The total bullish sentiment metric has declined by 33.08% within the last 7 days though there is a rapid surge in the spam volume which is an ominous indication regarding the social media metrics of the token.
In the previous analysis, the price reached the 200 EMA resistance level hence it was estimated that the price can take a negative reversal from the point. The analysis may stand true as the price is making a downward curve often observed before a bear turn.
Technical Analysis of QNT Price (Daily Timeframe)
Presently, the price is trading near a critical rejection level, it projects a potential possibility of further decline if the bears succeed in regaining prominence, according to LunarCrush.
The 200 EMA is acting as a crucial rejection level to the QNT price. The current support level for the price is around $108 and its major support level is at $100. The resistance point for QNT is near $120 and its major resistance is at $130.
The RSI line is giving a pessimistic interception to the 14 SMA after taking rejection from the supply zone. The RSI line is currently moving around 56.13 points, while the 14 SMA is providing resistance at nearly 55.84 points.
Conclusion
As per the analysis, the price is taking a reversal from the 200 EMA key level. The price may soon follow the oscillators’ lead which is taking resistance from the oversold levels on the daily time frame indicating a bearish correction.
Technical levels
Support – $90 and $100
Resistance – $120 and $130
Disclaimer
The views and opinions stated by the author, or any people named in this article, are for informational purposes only, and they do not establish financial, investment, or other advice. Investing in or trading crypto assets comes with a risk of financial loss.


 Bitcoin
  Ethereum
  Tether
  USDC
USDC  TRON
TRON  Dogecoin
  Cardano
  Bitcoin Cash
  Chainlink
  Monero
  LEO Token
  Zcash
Zcash  Stellar
  Litecoin
  Hedera
  Dai
Dai  Cronos
  Tether Gold
  OKB
OKB  Ethereum Classic
  KuCoin
  Gate
Gate  Algorand
  Cosmos Hub
  VeChain
  Dash
Dash  TrueUSD
  Tezos
Tezos  Stacks
  IOTA
IOTA  Basic Attention
  Decred
  Theta Network
  NEO
NEO  Synthetix
  Qtum
Qtum  Ravencoin
  DigiByte
  0x Protocol
  Nano
Nano  Zilliqa
  Siacoin
  Numeraire
  Waves
Waves  BUSD
BUSD  Status
  Enjin Coin
  Pax Dollar
  Ontology
  Hive
Hive  Lisk
Lisk  Steem
Steem  Huobi
Huobi  NEM
NEM  OMG Network
  Bitcoin Gold
  Augur
Augur  Ren
Ren  HUSD
HUSD