Polkadot Price Follows a Negative Trend: Will DOT Breakout?

Polkadot protocol has developed into an open-source multichain protocol that gets this funky name for securing a few networks of special blockchains or market leaders to facilitate cross-chain trades, asset transfer, and promote interoperability of blockchains with each other. Polkadot is working to create a fully functional decentralized internet of blockchain, thus laying the pathway toward the Web 3.0 revolution. Since such a project hasn’t been visualized yet, the progress can be slow.
The latest market capitalization of Polkadot based on the current value remains $6,612,462,992, with 90% of DOT tokens having entered the circulation markets. The potential for its DOT token remains uncharted since Web 3.0 is still a concept, and achieving such a state can create a whole new paradigm of DOT apart from its current use as governance, staking, and bonding token.
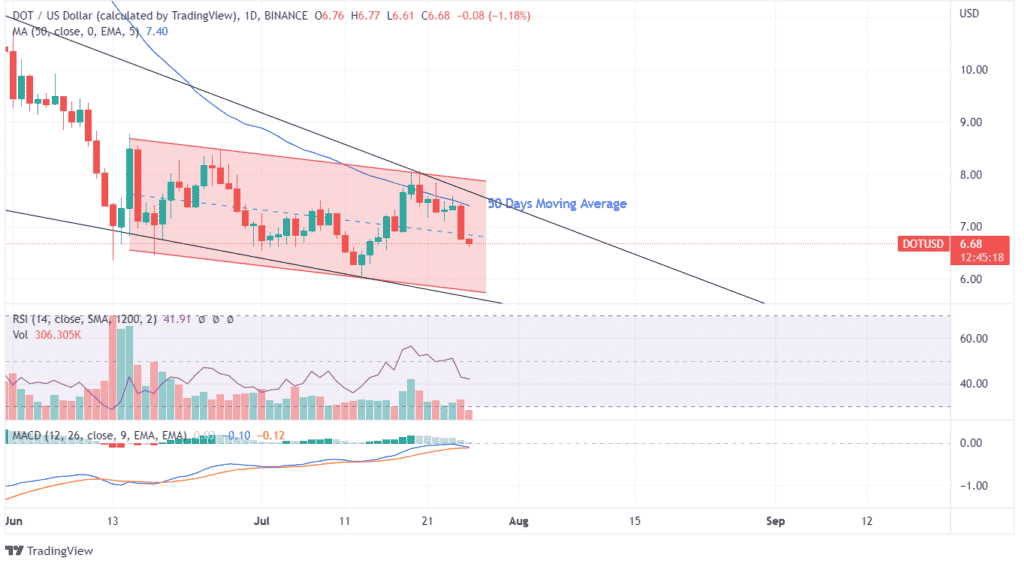
DOT token failed to surpass the 50 EMA curve, which was already in a downfall. This failure highlights the critical lack of buying momentum despite a higher RSI shown on charts. Technicals have highlighted the downtrend movement, and the trendline showcases a bearish crossover. Read our Polkadot prediction to know if it is the right time to buy the token!

DOT token has taken new dips with each swing. When prices jumped on July 13, making a peak gain in the sentiment started to shift toward the buyers. But despite making a huge spike in seven days, the failure to overcome its 50 EMA curve highlighted the doubt in buyers’ enthusiasm to push the prices down. The resultant profit booking has eroded significant wealth in the last six days, which strengthens the fear the DOT hasn’t yet made its true dip.
Simultaneously, the MACD indicator has almost created a bearish crossover which will showcase a profit booking on a much larger scale. The trendlines on the upper band indicate a decline, showcasing the failure of the DOT token to create subsequent higher highs.

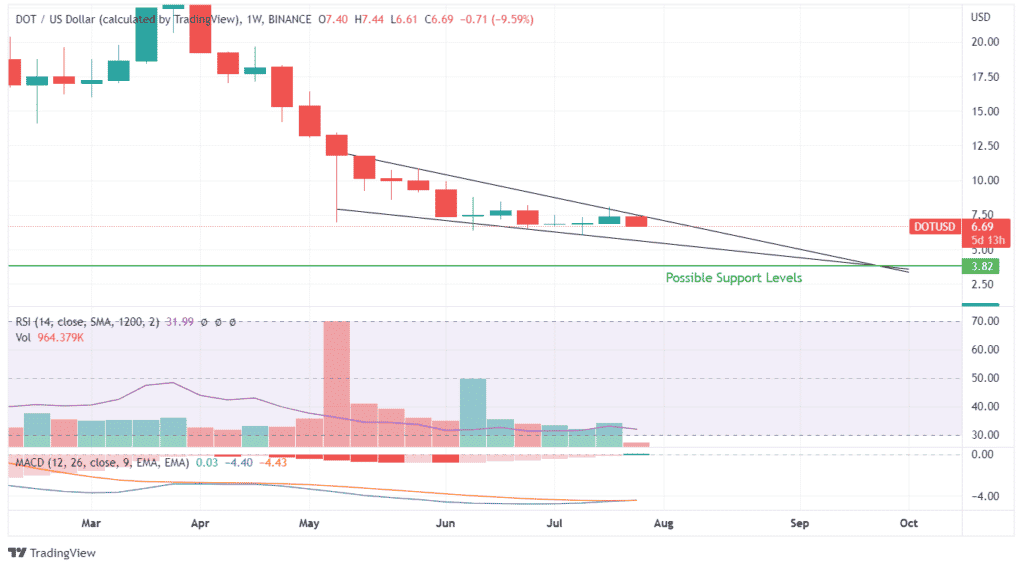
The weekly price action of Polkadot highlights a long-established trend line since the beginning of May 2022 that isn’t breached so far. These trend lines intersect near $3.8, showcasing a further decline. It raises a serious flaw despite the price action not being highly negative.
Instead, the trend also showcases a consolidation between $8 and $6. The current weekly candle has completely engulfed all the positive trade of the last two weeks. RSI has also declined towards oversold zones, and MACD also indicates a downward curve despite its bullish crossover.


 Bitcoin
  Ethereum
  Tether
  USDC
USDC  TRON
TRON  Dogecoin
  Cardano
  Bitcoin Cash
  Chainlink
  Monero
  LEO Token
  Zcash
Zcash  Stellar
  Litecoin
  Hedera
  Dai
Dai  Cronos
  Tether Gold
  OKB
OKB  Ethereum Classic
  KuCoin
  Gate
Gate  Algorand
  Cosmos Hub
  VeChain
  TrueUSD
  Dash
Dash  Tezos
Tezos  Stacks
  IOTA
IOTA  Basic Attention
  Decred
  Theta Network
  NEO
NEO  Synthetix
  Qtum
Qtum  Ravencoin
  DigiByte
  0x Protocol
  Nano
Nano  Zilliqa
  Siacoin
  Numeraire
  Waves
Waves  BUSD
BUSD  Status
  Pax Dollar
  Enjin Coin
  Ontology
  Hive
Hive  Lisk
Lisk  Steem
Steem  Huobi
Huobi  OMG Network
  NEM
NEM  Bitcoin Gold
  Augur
Augur  Ren
Ren  HUSD
HUSD