TA- Trezor (TRB) Holds Strong Above $40, Will The Crypto Pullback Affect It?

The price of Trezor (TRB) in the last few days has continued to look strong against Tether (USDT). Bitcoin (BTC), Ethereum (ETH), and other altcoins have struggled to hold above their key support zones after the market turned bearish. The price of Trezor (TRB) has continued to maintain its bullish structure. (Data from Binance)
Related Reading: Bitcoin Price Short-Term Upswing In Peril As Bulls’ Aggression Dies Down
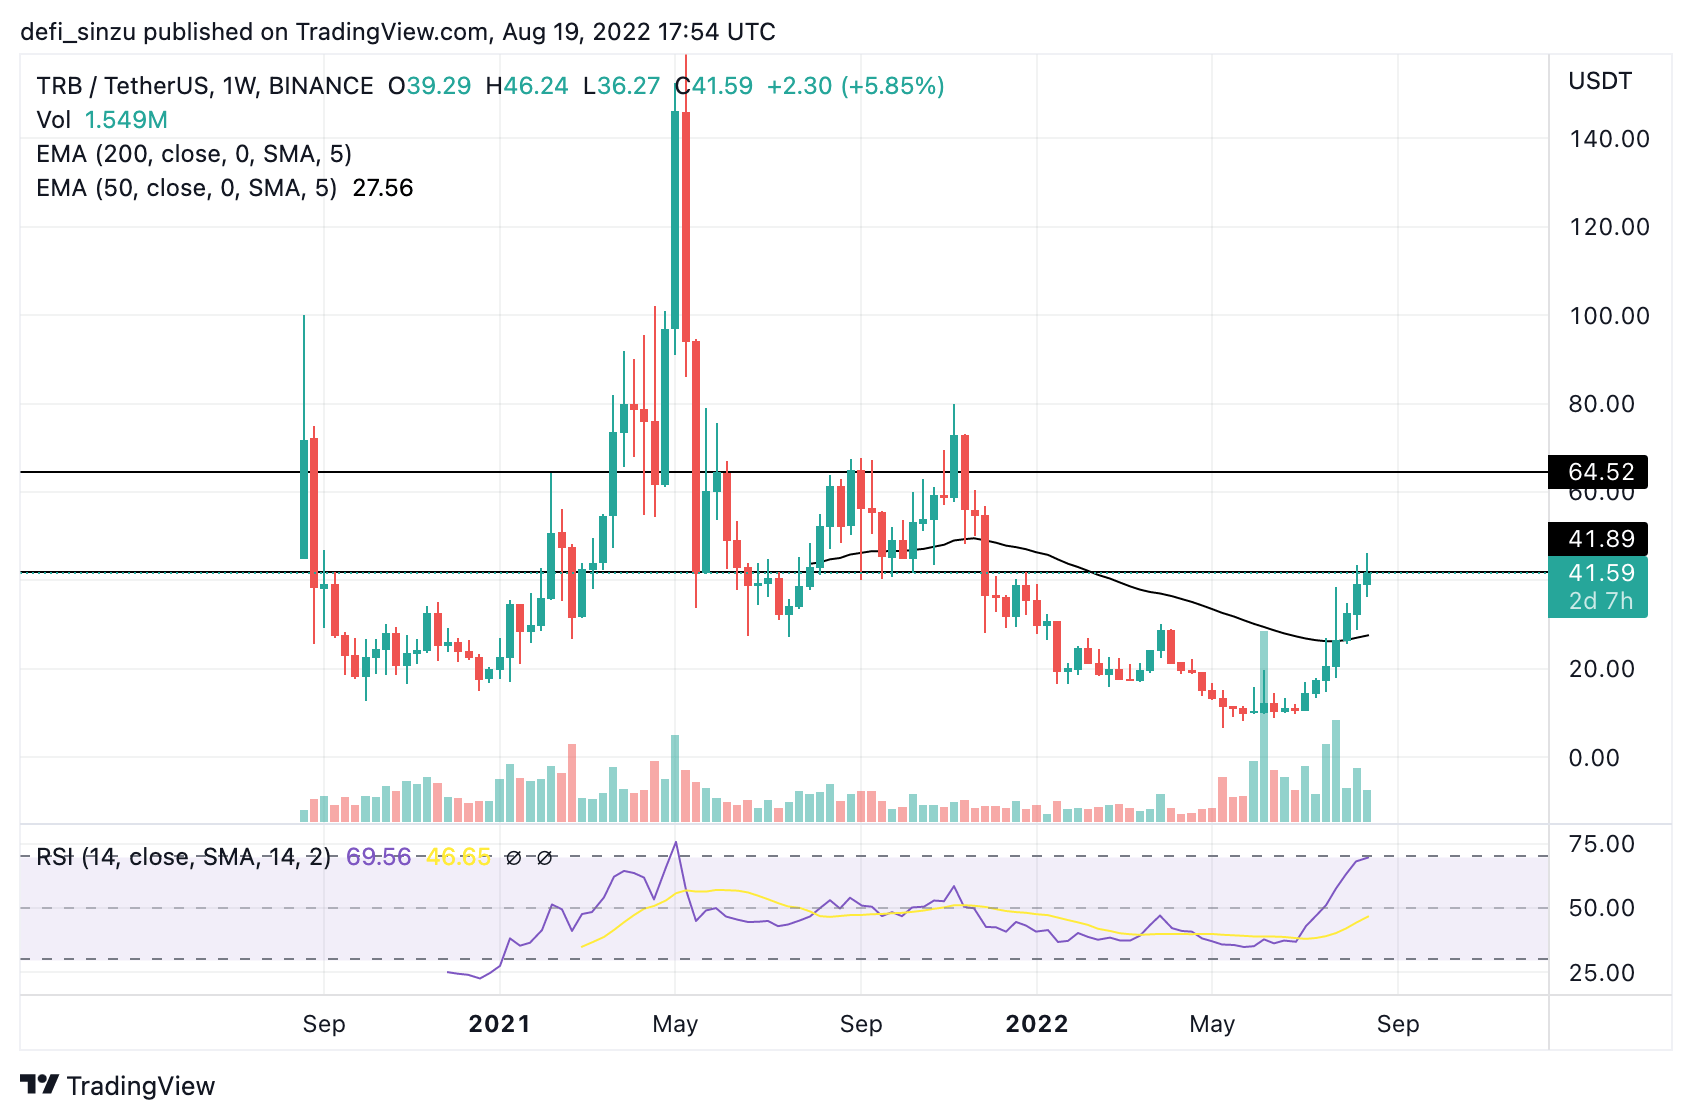
Trezor (TRB) Price Analysis On The Weekly Chart

From the chart, the price of TRB saw a weekly low of $10, which bounced from that area and rallied to a price of $40 after showing great recovery signs in recent weeks.
TRB weekly candle closed with a bullish sentiment with the new week’s candle looking bullish with eyes set for the $60 mark.
The price has struggled to build more momentum as it tries to hold key support.
If the price of TRB on the weekly chart continues with this structure, it could quickly revisit $60 acting as a resistance to the price of TRB.
Weekly resistance for the price of TRB – $40, $60.
Weekly support for the price of TRB – $28.
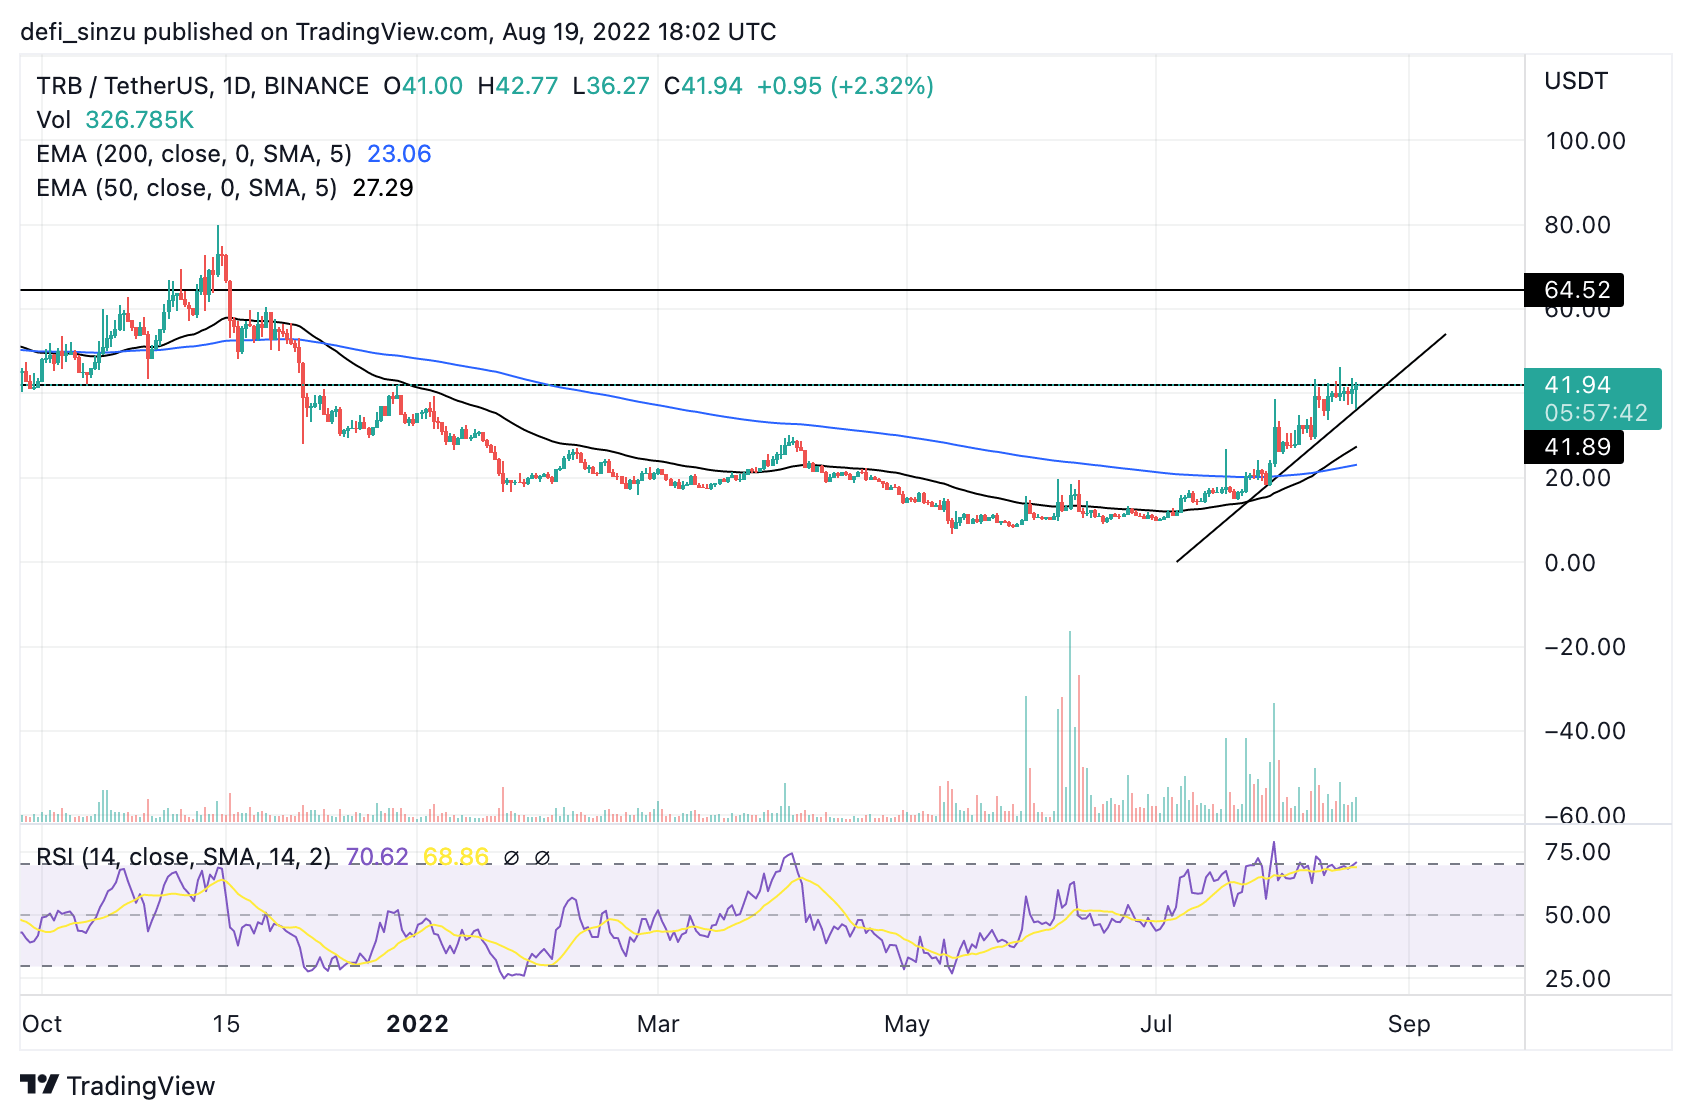
Price Of Trezor On The Daily (1D) Chart

The price of TRB found strong support at $28 above a trendline after successfully forming a bullish structure, the support at $28 seems to be an area of interest on the daily chart.
TRB bounced from its support and rallied to $40 where it was faced with resistance.
The price of TRB has formed an uptrend line acting as a support for the price of TRB.
The price of TRB needs to hold above this trendline, a break below it invalidates the bullish structure.
At the point of writing, the price of TRB is at $40, just above the 50 and 200 Exponential Moving Average (EMA) which corresponds to prices at $28 and $24.
The Relative Strength Index (RSI) for the price of TRB on the daily chart is below 70, indicating more buy bids.
Daily (1D) resistance for TRB price – $40.
Daily (1D) support for TRB price – $28, $24.
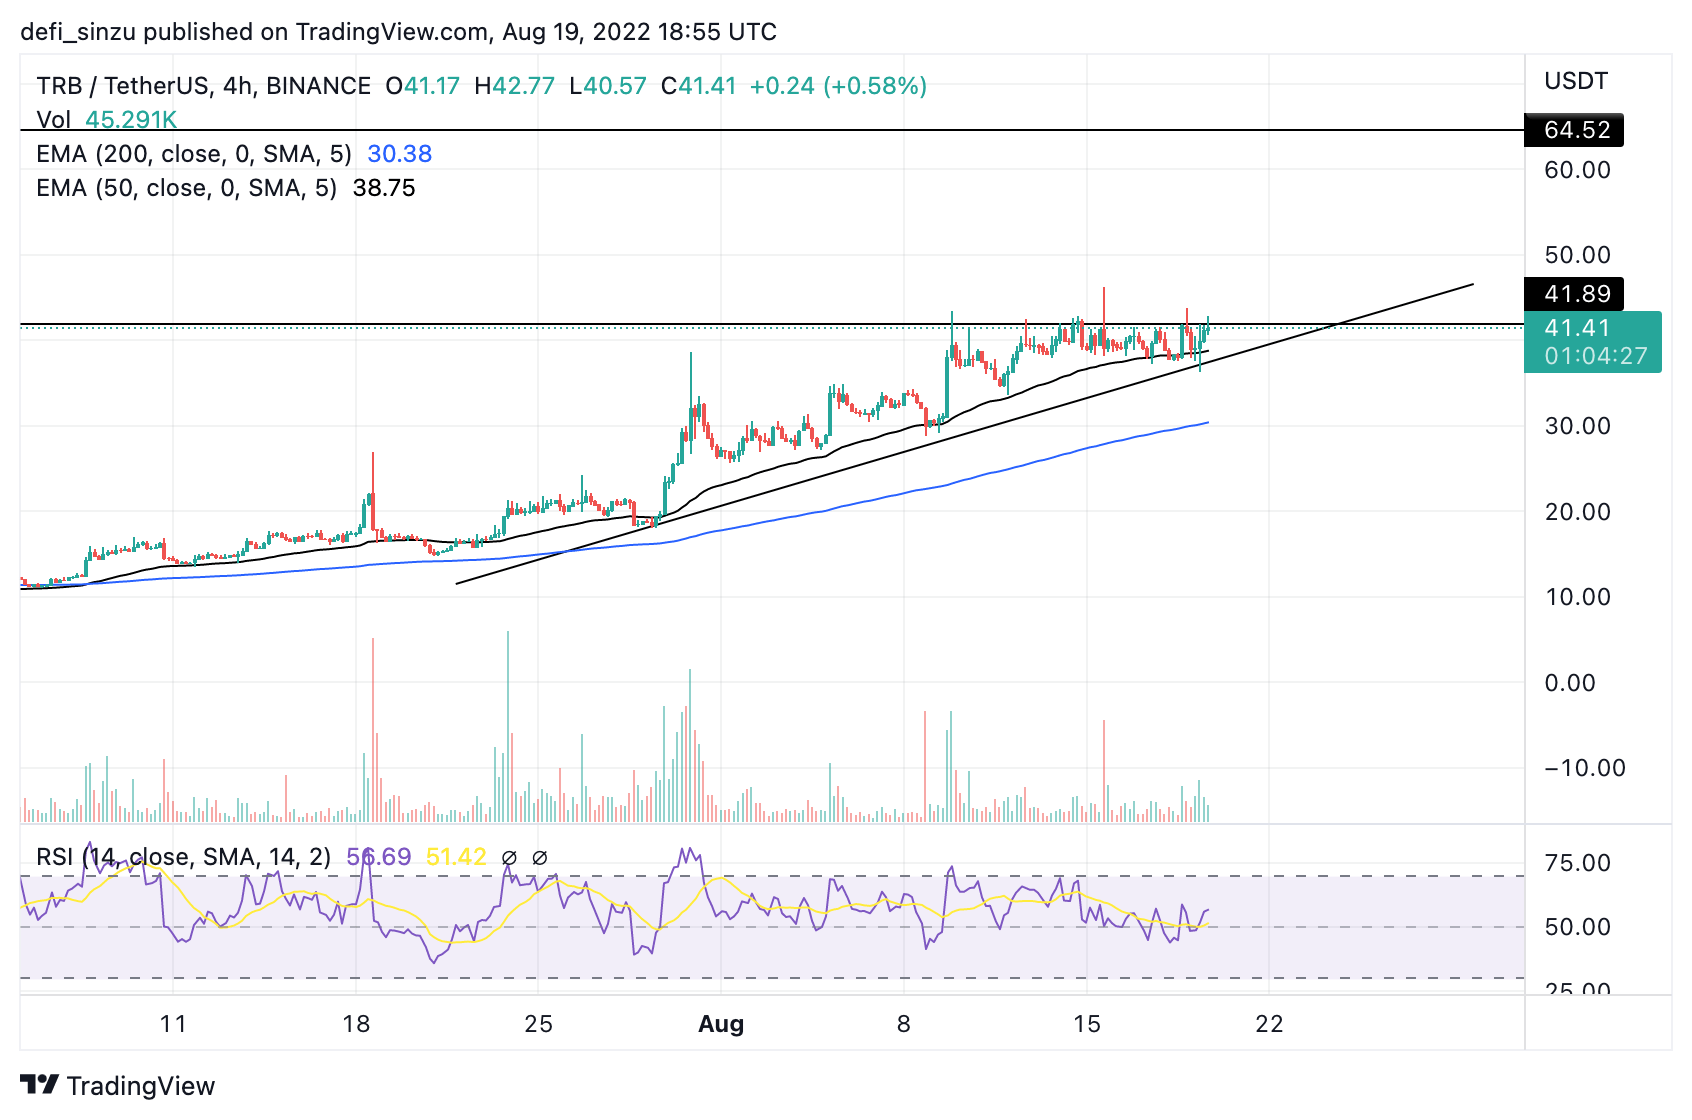
Price Analysis Of TRB On The Four-Hourly (4H) Chart

The price of TRB has continued to sustain its bullish structure above the 50 EMA price corresponding to $38 acting as support and area of interest.
On the 4H timeframe, the 200 EMA is also acting as key support for the price of TRB.
If TRB fails to hold the support region of 50 and 200 EMA which corresponds to $38 and 30$ we could see the price retesting the region of $21 as the next support area to hold the TRB price.
Four-Hourly (4H) resistance for TRB price – $40.
Four-Hourly (4H) support for TRB price – $38, $30.
Related Reading: Bitcoin Price Declines Below 50-Day MA, Is A Recovery Expected?
Featured Image From ITPRO, Charts from TradingView.com


 Bitcoin
  Ethereum
  Tether
  USDC
USDC  Dogecoin
  TRON
TRON  Cardano
  Bitcoin Cash
  Chainlink
  LEO Token
  Stellar
  Hedera
  Litecoin
  Monero
  Dai
Dai  OKB
OKB  Cronos
  Ethereum Classic
  Gate
Gate  VeChain
  Cosmos Hub
  Algorand
  KuCoin
  Stacks
  Tether Gold
  Theta Network
  Zcash
Zcash  IOTA
IOTA  Tezos
Tezos  TrueUSD
  NEO
NEO  Ravencoin
  Polygon
  Decred
  Dash
Dash  Qtum
Qtum  Zilliqa
  Synthetix Network
  0x Protocol
  Basic Attention
  Siacoin
  Status
  Holo
Holo  DigiByte
  Enjin Coin
  Nano
Nano  Ontology
  Waves
Waves  Hive
Hive  Lisk
Lisk  Pax Dollar
  Steem
Steem  Numeraire
  BUSD
BUSD  Huobi
Huobi  NEM
NEM  OMG Network
  Bitcoin Gold
  Ren
Ren  Bitcoin Diamond
  Augur
Augur  Energi