Uniswap Turns from the Recent High as It Revisits the Previous Low at $4.25

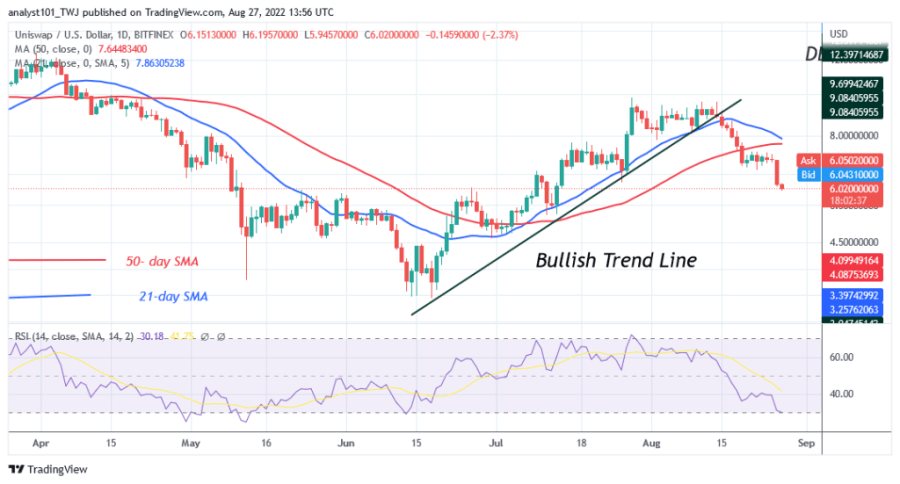
The price of Uniswap (UNI) is in a downtrend as the altcoin has fallen to a low of $6.07. The cryptocurrency will continue to decline as the price bars are below the moving average lines.
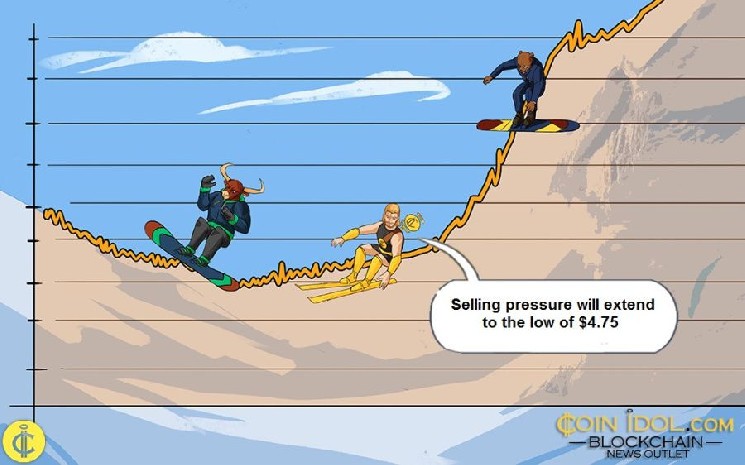
Selling pressure will extend to the low of $4.75, the historical price level from July 1. In early July, buyers rallied above the $4.75 support as the market reached the previous high of $9.80. Today, the current decline is approaching the oversold region of the market. Selling pressure will ease in the oversold region. Buyers will be attracted to the oversold region to push prices higher.
Uniswap indicator analysis
Uniswap indicator is at level 30 of the Relative Strength Index for period 14, indicating that the cryptocurrency has reached the oversold region of the market. The selling pressure is likely to ease when the market reaches the oversold region. It is also below the 80% area of the daily stochastic. The market is in a bearish momentum.

Technical indicators
Key Resistance Zones: $12.00, $14.00, $16.00
Key Support Zones: $10.00, $8.00, $6.00
What is the next direction for Uniswap?
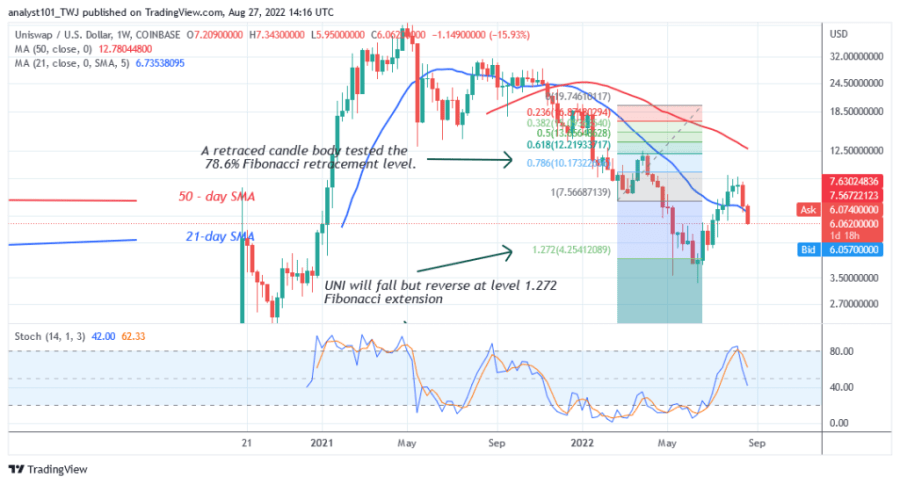
Uniswap is in a downtrend and faces rejection at the $9.80 high. Selling pressure could continue if the price falls below the moving average lines. On the weekly chart, a candlestick tested the 78.6% Fibonacci retracement level on March 28. The retracement suggests that UNI will fall to the 1.272 Fibonacci extension level or the $6.09 level. From the price action, UNI has regained the previous low of the 1.272 Fibonacci extension of June 13. It is likely that the bears will regain the previous low.

Disclaimer. This analysis and forecast are the personal opinions of the author and are not a recommendation to buy or sell cryptocurrency and should not be viewed as an endorsement by CoinIdol. Readers should do their research before investing in funds.


 Bitcoin
  Ethereum
  Tether
  USDC
USDC  TRON
TRON  Dogecoin
  Cardano
  Bitcoin Cash
  Chainlink
  Monero
  LEO Token
  Zcash
Zcash  Stellar
  Litecoin
  Hedera
  Dai
Dai  Cronos
  Tether Gold
  OKB
OKB  Ethereum Classic
  KuCoin
  Gate
Gate  Algorand
  Cosmos Hub
  VeChain
  TrueUSD
  Dash
Dash  Tezos
Tezos  Stacks
  IOTA
IOTA  Basic Attention
  Theta Network
  Decred
  NEO
NEO  Synthetix
  Qtum
Qtum  Ravencoin
  DigiByte
  0x Protocol
  Nano
Nano  Zilliqa
  Holo
Holo  Siacoin
  Numeraire
  Waves
Waves  Status
  BUSD
BUSD  Pax Dollar
  Enjin Coin
  Ontology
  Hive
Hive  Lisk
Lisk  Steem
Steem  Huobi
Huobi  OMG Network
  NEM
NEM  Bitcoin Gold
  Augur
Augur  Ren
Ren  HUSD
HUSD