

Hedera Price Analysis: Will HBAR Crypto Escape this Descending Pattern?

- Hedera’s price is trying to sustain itself at the current level and register its breakout from the descending triangle pattern.
- HBAR crypto has recovered till 20 EMA but is still below 50, 100, and 200-days Daily Moving Average.
- The pair of HBAR/BTC is at 0.000003028 BTC with an intraday drop of 3.77%.
The Hedera price needs to break through the collapsing wedge formation on the daily price chart. The coin has to attract additional buyers in order to break out of the Descending triangle pattern. On HBAR Coin, which is aiming to build up bulls to signal its breakout, a descending triangle formation is set to appear. The token is still unable to gather enough positive forces to finish its breakout, thus the accumulation doesn’t seem to be on track. Investors in HBAR must hold off on making any purchases until the token is prepared to end its downward trend. The token, however, is currently being controlled by bears and is set to experience a meltdown.
The current estimated price of Hedera is $0.0635, and on the previous day, the cryptocurrency’s market value increased by 4.86%. The intraday trading session saw a 30.16% incline in trade volume. This demonstrates how buyers are attempting to push an HBAR Crypto. The volume to market cap ratio is 0.02439.
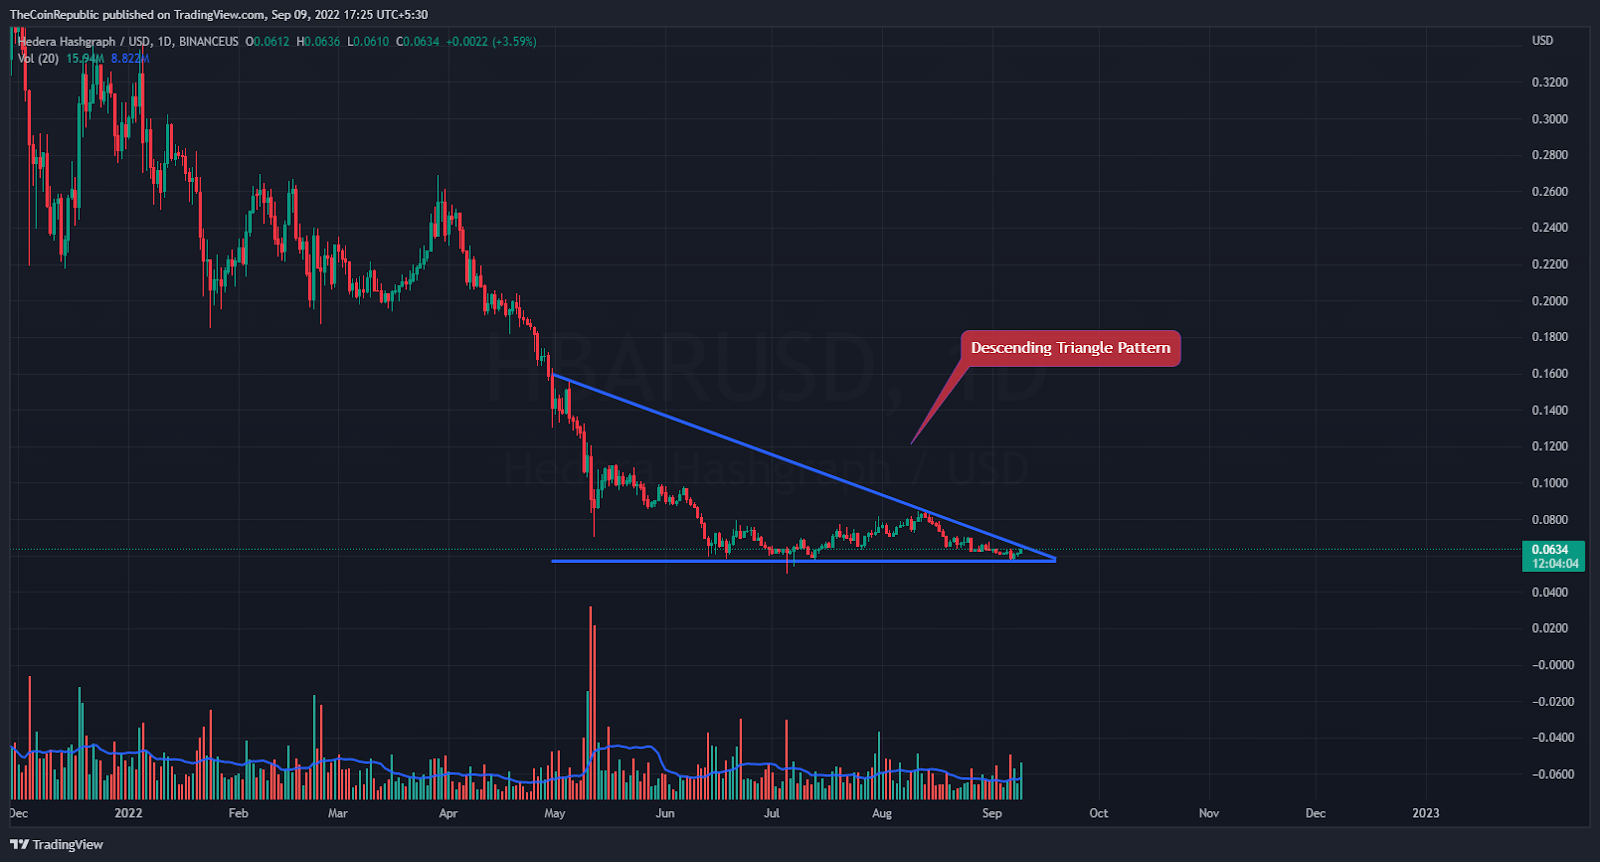
Source: HBAR/USD by TradingView
The HBAR coin price has to attract a substantial number of buyers in order to exit the descending triangle pattern over the daily price chart. On the verge of the descending triangle pattern, the token is now having problems. The decreasing volume change trend indicates the token’s decrease within the descending triangle pattern. Accumulation of HBAR coins is necessary to maintain the top trendline.
What do Technical Indicators suggest about HBAR?
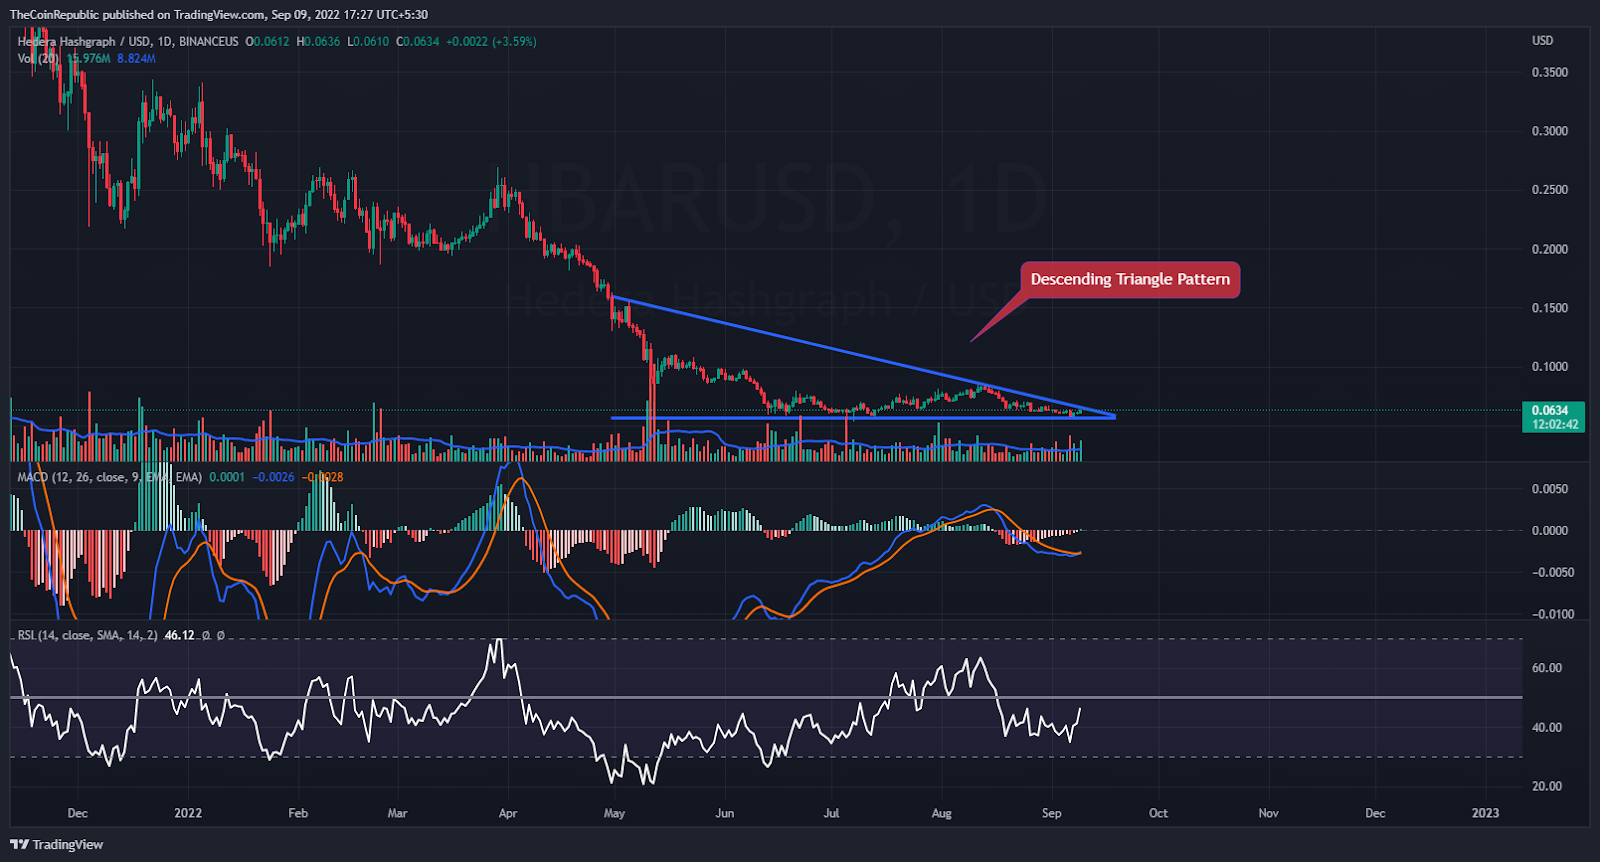
Source: HBAR/USD By TradingView
Bulls are attempting to support HBAR cryptocurrency. The digital object needs to escape the descending triangular pattern. Technical indicators point to HBAR’s momentum being in an upswing while forming a descending triangle formation.
The relative Strength Index showcases the uptrend momentum of HBAR inside the descending triangle. RSI is at 46 and is heading towards neutrality. MACD exhibits the uptrend momentum of the HBAR coin inside the descending triangle pattern. The MACD line is about to cross the signal line downwards resulting in a negative crossover.
Conclusion
The Hedera price needs to break through the collapsing wedge formation on the daily price chart. The coin has to attract additional buyers in order to break out of the Descending triangle pattern. On HBAR Coin, which is aiming to build up bulls to signal its breakout, a descending triangle formation is set to appear. The token is still unable to gather enough positive forces to finish its breakout, thus the accumulation doesn’t seem to be on track. Investors in HBAR must hold off on making any purchases until the token is prepared to end its downward trend. The decreasing volume change trend indicates the token’s decrease within the descending triangle pattern. Accumulation of HBAR coins is necessary to maintain the top trendline. Technical indicators point to HBAR’s momentum being in an upswing while forming a descending triangle formation. The MACD line is about to cross the signal line downwards resulting in a negative crossover.
Technical Levels
Support Level: $0.055
Resistance Level: $0.068
Disclaimer
The views and opinions stated by the author, or any people named in this article, are for informational ideas only, and they do not establish the financial, investment, or other advice. Investing in or trading crypto assets comes with a risk of financial loss.


 Bitcoin
  Ethereum
  Tether
  USDC
USDC  Dogecoin
  Cardano
  Bitcoin Cash
  Zcash
Zcash  LEO Token
  Stellar
  Litecoin
  Hedera
  Tether Gold
  OKB
OKB  KuCoin
  Gate
Gate  Algorand
  Cosmos Hub
  VeChain
  TrueUSD
  IOTA
IOTA  Basic Attention
  Decred
  NEO
NEO  Synthetix
  0x Protocol
  Ravencoin
  DigiByte
  Nano
Nano  Holo
Holo  Siacoin
  Numeraire
  Waves
Waves  Ontology
  Status
  BUSD
BUSD  Enjin Coin
  Pax Dollar
  Steem
Steem  OMG Network
  Augur
Augur