ECash Price Analysis: What do Investors Need to do for XEC Crypto’s Breakout from the Range?

- eCash price has been trading inside the horizontal range-bound area over the daily chart.
- XEC crypto has fallen below the 20, 50, 100, and 200-day Daily Moving Average.
- The pair of XEC/BTC is at 0.000000002136 BTC with an intraday drop of 1.72%.
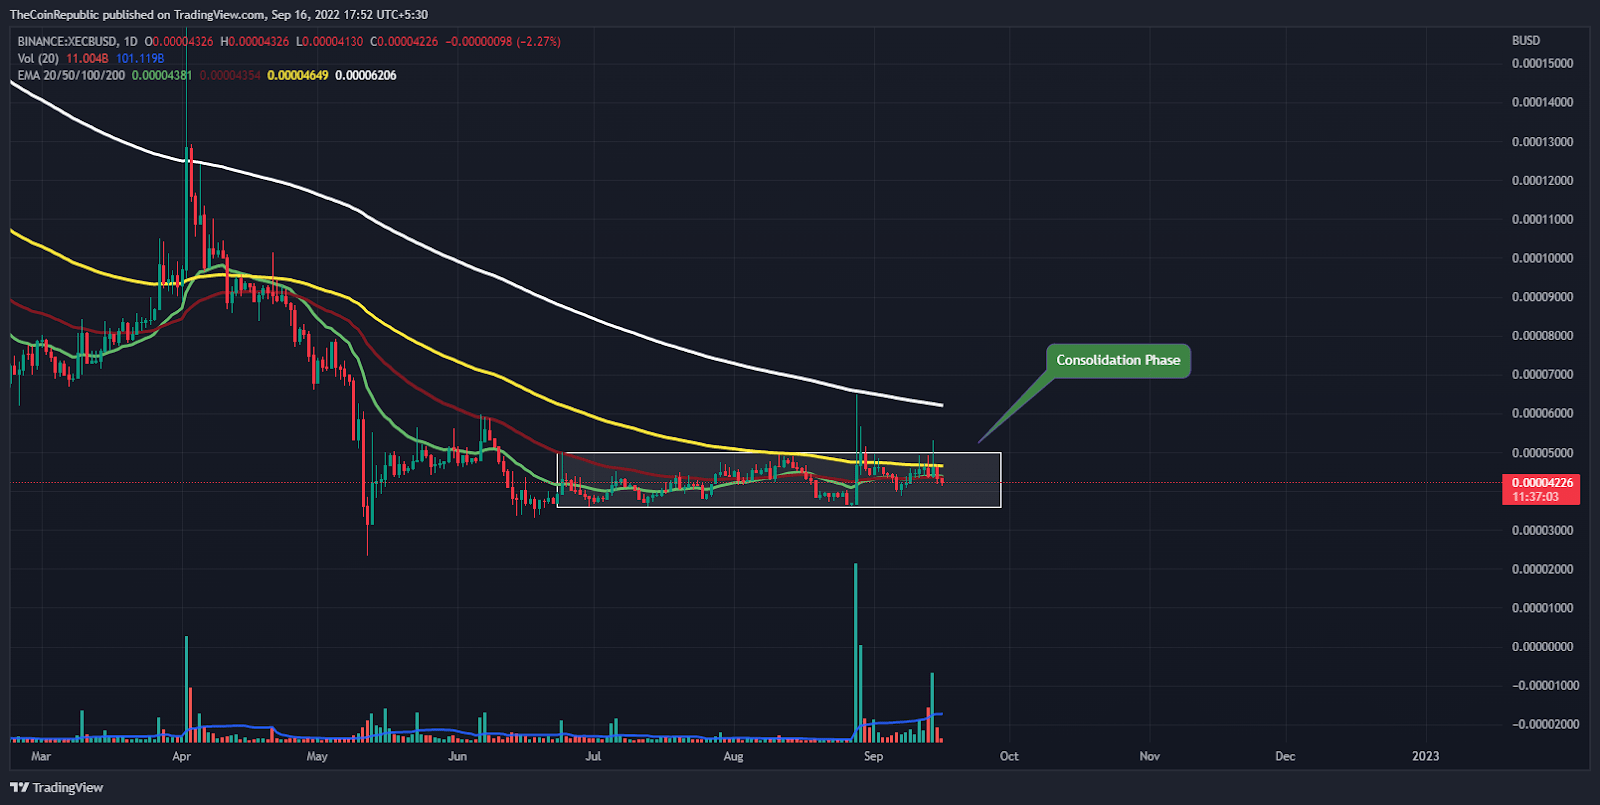
Since June 23, the price of eCash has been constant within the area of horizontal range-bound trading. The token has been trying to break out of the consolidation phase, but bulls have repeatedly failed to hold gains at the level of the consolidation phase. XEC’s upbeat outlook suggests that they are concentrated on recording the token’s exit from the horizontal zone this time. However, the token’s price has remained constant around $0.000035 to $0.000050. The price of XEC is currently strongly going upward and rising into the top range of the consolidation period. To allow the token to go above the caged area, XEC bulls must maintain their position at the trendline.
The estimated price of eCash is currently $0.00004226, and the previous day saw a decline in market capitalization of 3.42%. But during the intraday trading session, there were 67.40% fewer trades. This would indicate that bears are trying to accumulate in preparation for the XEC cryptocurrency’s price decline. The volume to market cap ratio is 0.03445.

Source: XEC/USD by TradingView
On the daily price chart, the price of XEC is moving upward toward the upper trendline of the consolidation phase. To see the breakout of the token, bulls must gather at XEC. Bears, however, have the ability to abruptly reverse the upward momentum of the XEC coin because volume shows that the rate of accumulation is low. If bulls in XEC wish to avoid getting caught in any bearish traps, they must act quickly to buy.
What do Technical Indicators suggest about XEC?

Source: XEC/USD by TradingView
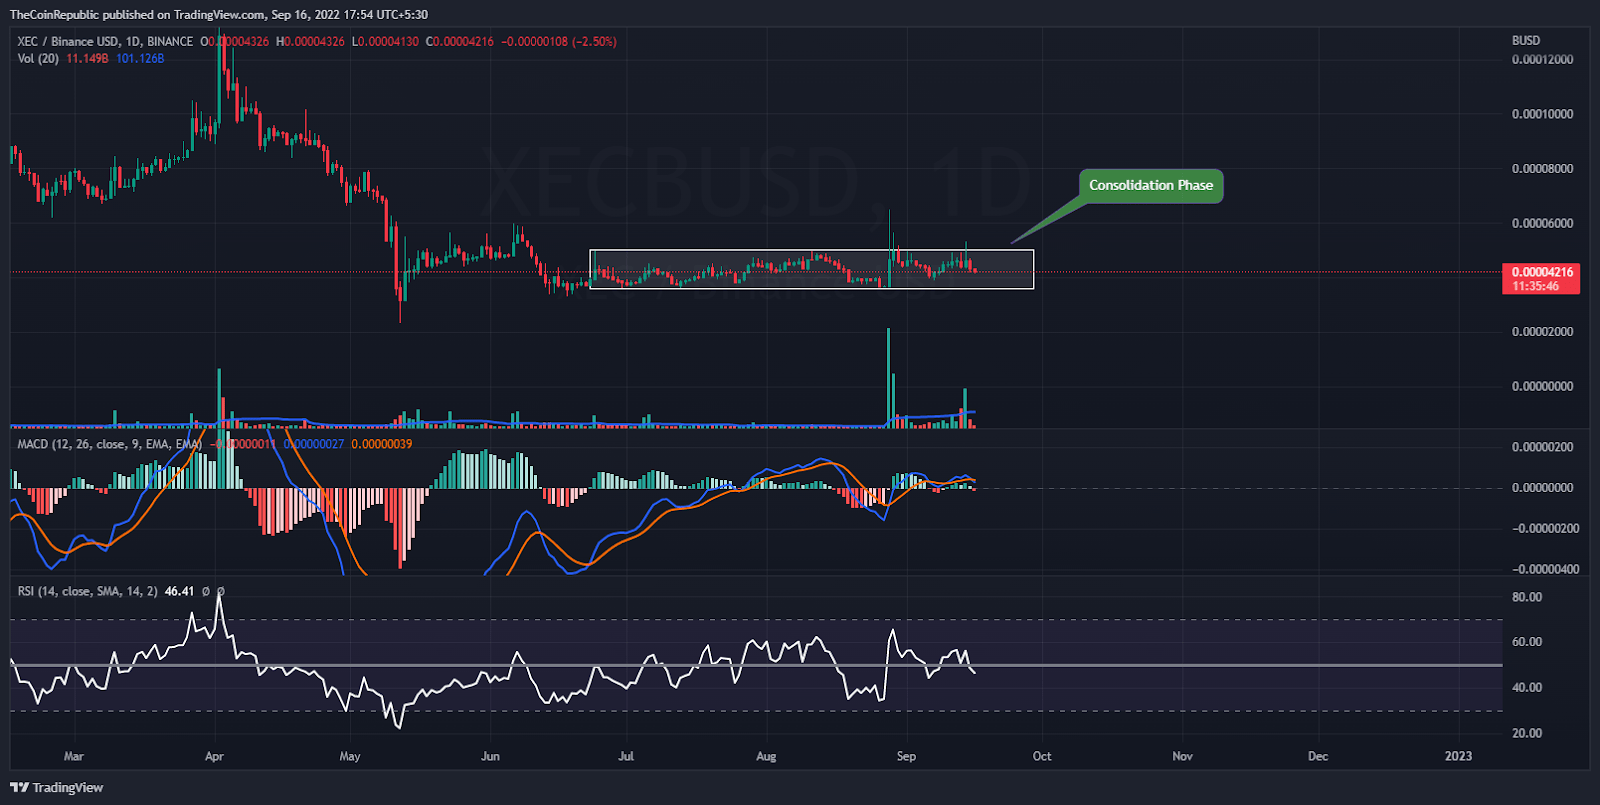
During the consolidation stage of the daily chart, the price of the XEC coin is trying to hold at the present level. Technical indicators highlight the downward momentum of the XEC coin.
The strength of the XEC coin’s downturn is demonstrated by the relative strength index. At 46, the RSI is just above neutrality. The XEC coin’s consolidation phase can be seen on the MACD. The signal line is below the MACD line. Investors in XEC must watch the daily chart for any directional changes.
Conclusion
Since June 23, the price of eCash has been constant within the area of horizontal range-bound trading. The token has been trying to break out of the consolidation phase, but bulls have repeatedly failed to hold gains at the level of the consolidation phase. XEC’s upbeat outlook suggests that they are concentrated on recording the token’s exit from the horizontal zone this time. However, the token’s price has remained constant around $0.000035 to $0.000050. The price of XEC is currently strongly going upward and rising into the top range of the consolidation period. If bulls in XEC wish to avoid getting caught in any bearish traps, they must act quickly to buy. Technical indicators highlight the downward momentum of the XEC coin. The signal line is below the MACD line. Investors in XEC must watch the daily chart for any directional changes.
Technical Levels
Support Levels: $0.000040 and $0.000035
Resistance Levels: $0.00004 and $0.000050
Disclaimer
The views and opinions stated by the author, or any people named in this article, are for informational ideas only, and they do not establish any financial, investment, or other advice. Investing in or trading crypto assets comes with a risk of financial loss.


 Bitcoin
  Ethereum
  Tether
  USDC
USDC  TRON
TRON  Dogecoin
  Cardano
  Bitcoin Cash
  Chainlink
  LEO Token
  Monero
  Stellar
  Zcash
Zcash  Litecoin
  Hedera
  Dai
Dai  Cronos
  OKB
OKB  Tether Gold
  Ethereum Classic
  KuCoin
  Gate
Gate  Algorand
  Cosmos Hub
  VeChain
  Dash
Dash  Tezos
Tezos  TrueUSD
  Stacks
  IOTA
IOTA  Basic Attention
  Theta Network
  Decred
  NEO
NEO  Synthetix
  Qtum
Qtum  Ravencoin
  0x Protocol
  DigiByte
  Zilliqa
  Nano
Nano  Holo
Holo  Numeraire
  Siacoin
  Waves
Waves  Ontology
  BUSD
BUSD  Status
  Enjin Coin
  Pax Dollar
  Hive
Hive  Lisk
Lisk  Steem
Steem  Huobi
Huobi  NEM
NEM  OMG Network
  Bitcoin Gold
  Augur
Augur  Ren
Ren