AAVE Technical Analysis: Bulls Plan The Consolidation Trap Breakout

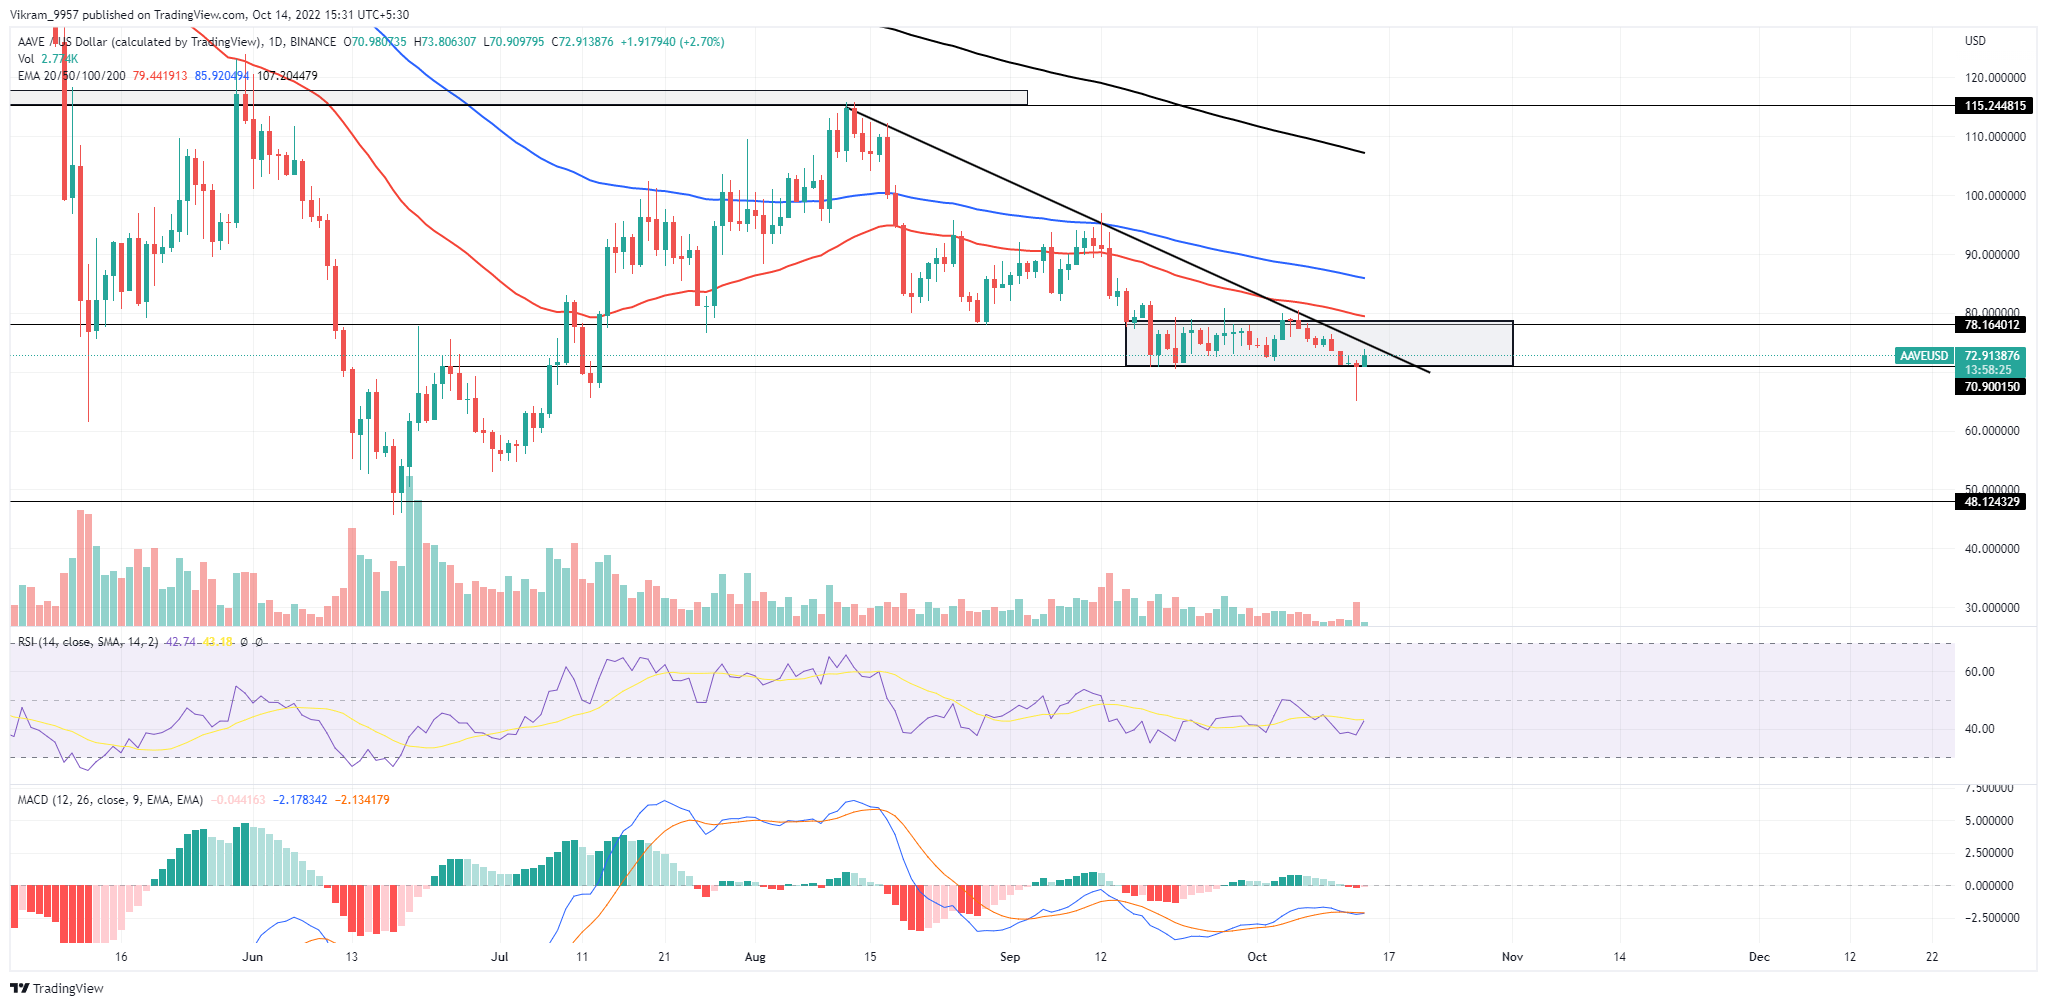
The AAVE technical analysis shows a bull cycle starting in the consolidation range challenging the resistance trendline to end the declining trend. The AAVE price action displays a bear trend starting a consolidation range between the $70-$78 mark in the daily chart. Currently, the recent bull cycle in the range pattern forms a morning star pattern teasing a trendline breakout. So, should you consider grabbing this bullish opportunity in AAVE?
Key Points:
- The AAVE price action shows a highly influential bearish trendline in the daily chart.
- The reversal at $70 signals the start of a new bull cycle.
- The intraday trading volume in AAVE is $157 million.

Source-Tradingview
AAVE Technical Analysis
The AAVE price action maintains a declining trend after reversing from the $115 supply zone generating a resistance trendline. Additionally, the market value has declined by 38% in the influence of the resistance trendline. On analyzing the price trend, the market price shows a consolidation range between the $70 and $78 mark, cushioning the downtrend. Currently, a morning star forms at the base level of the triangle pattern, teasing the potential bullish breakout. Furthermore, the 2.46% intraday jump completing the morning star pattern supports the bullish breakout possibility. Therefore, if the buying pressure sustains, the AAVE prices will break the consolidation range and the resistance trendline to reach the $90 mark. Conversely, the bullish failure to break the resistance trendline will inevitably break the $70 support level, leading to a fall to $50.
Technical Indicator
The RSI slope projects a sideways trend struggling to rise above the halfway line, but the reversal in the nearly oversold zone reflects a rise in the underlying bullishness. However, the MACD and signal lines are choppy due to multiple inconclusive crossovers. Therefore, the technical indicators highlight a reversal possibility as the market recovers. As a result, the AAVE technical analysis signals a buying opportunity at the bullish breakout. Resistance levels- $78 and $90 Support levels- $70 and $50


 Bitcoin
  Ethereum
  Tether
  USDC
USDC  TRON
TRON  Dogecoin
  Cardano
  Bitcoin Cash
  Chainlink
  Monero
  LEO Token
  Zcash
Zcash  Stellar
  Litecoin
  Hedera
  Dai
Dai  Cronos
  Tether Gold
  OKB
OKB  Ethereum Classic
  KuCoin
  Gate
Gate  Algorand
  Cosmos Hub
  VeChain
  TrueUSD
  Dash
Dash  Tezos
Tezos  Stacks
  IOTA
IOTA  Basic Attention
  Theta Network
  Decred
  NEO
NEO  Synthetix
  Qtum
Qtum  Ravencoin
  DigiByte
  0x Protocol
  Nano
Nano  Zilliqa
  Siacoin
  Numeraire
  Waves
Waves  BUSD
BUSD  Status
  Pax Dollar
  Enjin Coin
  Ontology
  Hive
Hive  Lisk
Lisk  Steem
Steem  Huobi
Huobi  NEM
NEM  OMG Network
  Bitcoin Gold
  Augur
Augur  Ren
Ren  HUSD
HUSD