Polkadot Holds Above $6.00 as Sellers Attempt to Sink it to $4.00 Low

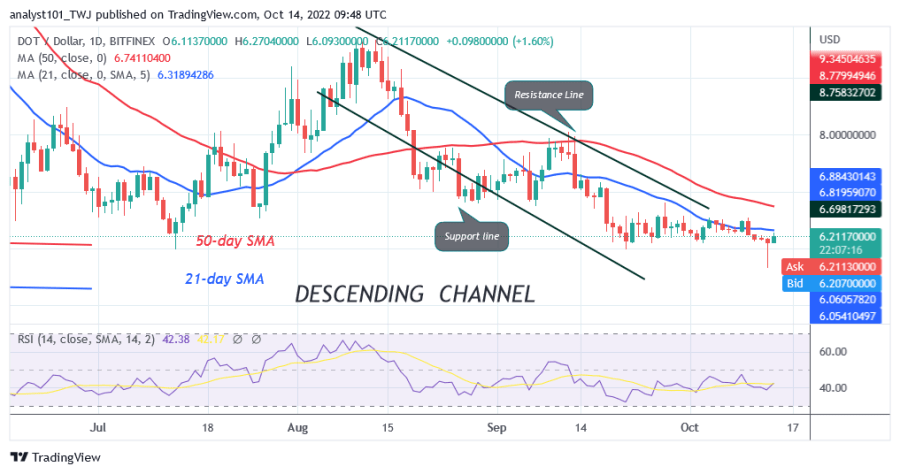
Polkadot (DOT) is in a downtrend as the cryptocurrency has fallen to the low of $5.65 and is retreating. The altcoin has risen above the $6.00 support level.
Since July 13, the cryptocurrency has been trading above the $5.98 support. On the upside, the DOT price is limited by the 21-day line SMA. The cryptocurrency risks a further decline. However, if the cryptocurrency price recovers, Polkadot will rally above the moving average lines. Today, the altcoin is rising to retest the 21-day line SMA. Selling pressure will increase again if the crypto turns down from the moving average lines.
Polkadot indicator analysis
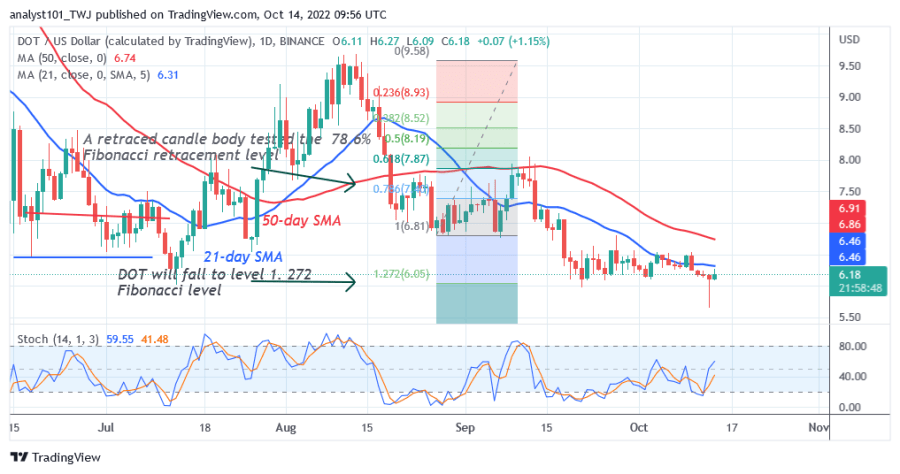
Polkadot has continued to slide lower at the 40 level of the Relative Strength Index for the 14 period. The altcoin is capable of a decline as the price bars are below the moving average lines. The cryptocurrency is below the 40% area of the daily stochastic. The moving average lines are pointing south, which indicates a downtrend.

Technical indicators
Key Resistance Zones: $10, $12, $14
Key Support Zones: $8.00, $6.00, $4.00
What is the next direction for Polkadot?
The cryptocurrency is consolidating above $5.98. The altcoin is expected to reverse above the $6.00 support. The market has reached the oversold region and buyers are expected to push prices higher. Polkadot is currently trading above $6.00.

Disclaimer. This analysis and forecast are the personal opinions of the author and are not a recommendation to buy or sell cryptocurrency and should not be viewed as an endorsement by CoinIdol. Readers should do their research before investing in funds.


 Bitcoin
  Ethereum
  Tether
  USDC
USDC  TRON
TRON  Dogecoin
  Cardano
  Chainlink
  Stellar
  Bitcoin Cash
  Hedera
  LEO Token
  Litecoin
  Cronos
  Monero
  Dai
Dai  OKB
OKB  Ethereum Classic
  Algorand
  VeChain
  Cosmos Hub
  Gate
Gate  KuCoin
  Tether Gold
  Stacks
  Tezos
Tezos  Theta Network
  IOTA
IOTA  Zcash
Zcash  TrueUSD
  NEO
NEO  Polygon
  Qtum
Qtum  Dash
Dash  Decred
  Synthetix Network
  Basic Attention
  Zilliqa
  0x Protocol
  Ravencoin
  Siacoin
  Holo
Holo  DigiByte
  Ontology
  Enjin Coin
  Waves
Waves  Nano
Nano  Numeraire
  Status
  Hive
Hive  Huobi
Huobi  Lisk
Lisk  Steem
Steem  Pax Dollar
  BUSD
BUSD  OMG Network
  NEM
NEM  Ren
Ren  Augur
Augur  Bitcoin Gold