Arbitrum price analysis: ARB consolidates around the $1.30 level, with bears dominating

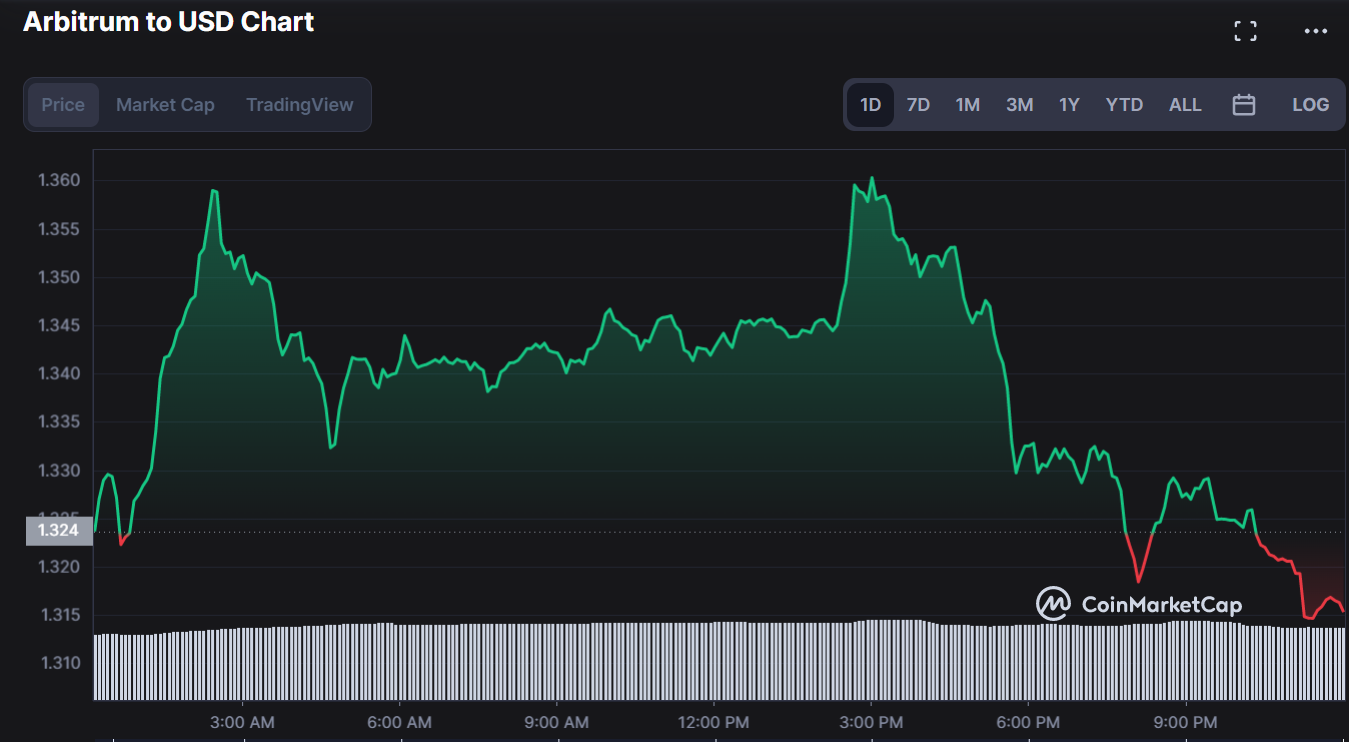
Today’s Arbitrum price analysis is bearish as the altcoin‘s price has been fluctuating between $1.31 to $1.36. The ARB token has been unable to break above the EMA200 (1.40) and is now heading toward its support level at $1.25. In the past 24 hours, arbitrum’s trading volume has increased significantly to approximately $330,184,640 while the market cap stands at $60,851,386 USD. The ARB token is currently trading hands at $1.32.

Arbitrum price action in the last 24 hours: Coinmarketcap
Looking ahead, if the support at $1.25 holds up we could see some bullish momentum in the next few days as buyers try to push the price back up towards its EMA200 (1.40) level. The Arbitrum token (ARB) has been trading between the exponential moving average (EMA) of 50 and 200 since mid-May, indicating a bearish market sentiment.
ARB/USD technical analysis on a daily chart: Bears remain adamant in pushing prices lower
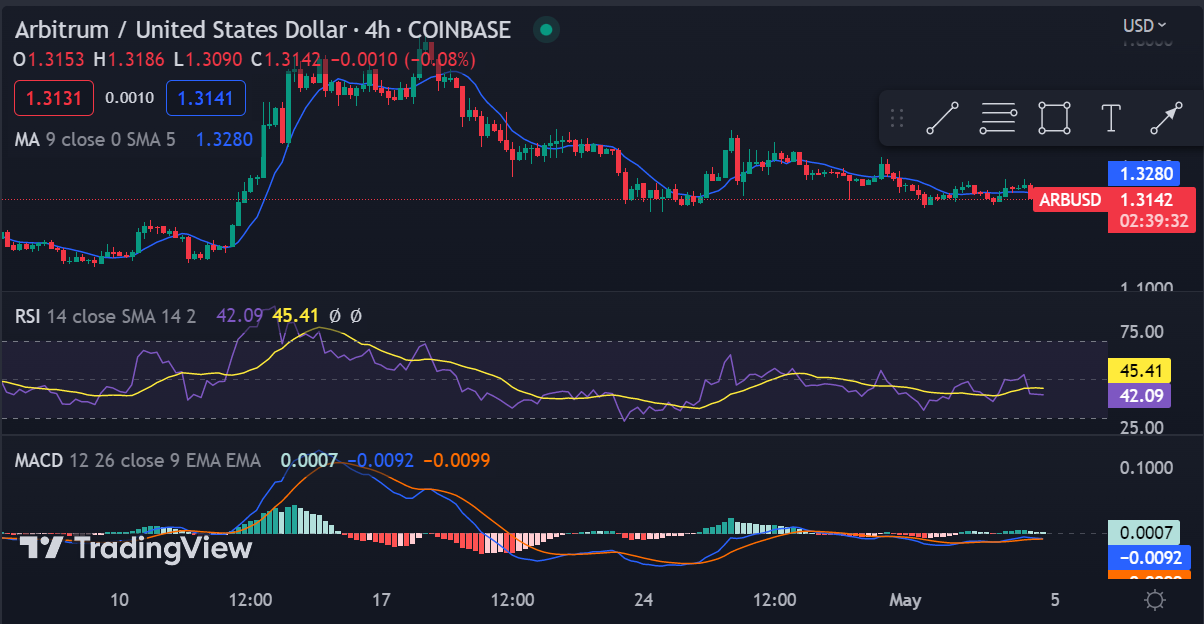
Arbitrum price analysis on the daily chart reveals the ARB token opened the daily trading session at an intraday low of $1.31, a bounce off from yesterday’s low of $1.27.The price then moved higher, reaching a peak of $1.36 before dropping below the EMA50 line (1.32). Since then it has been consolidating at around $1.32, a level where it has remained for the past 12 hours. The Relative Strength Indicator (RSI) has also dropped to 36.25, indicating that bears are still in control at the moment.

ARB/USD 1-day price chart: TradingView
A bearish engulfing pattern can be seen on the chart, indicating a bearish wave may be in play soon. In addition to this, both the MACD and Signal lines have crossed below the zero line, a sign of further bearish pressure.
Using the Fibonacci retracement tool on the daily chart, we can see that the price of Arbitrum has retraced to the 61.8% level from the high of $1.76 to the low of $1.08. The 61.8% level is acting as support, preventing any further losses. However, if the price breaks below this level, the next support level is at the 78.6% level, which is at $1.23. On the upside, the first resistance level is at the 38.2% level, which is at $1.45.
Arbitrum price analysis on a 4-hour chart: Bearish momentum is still in play
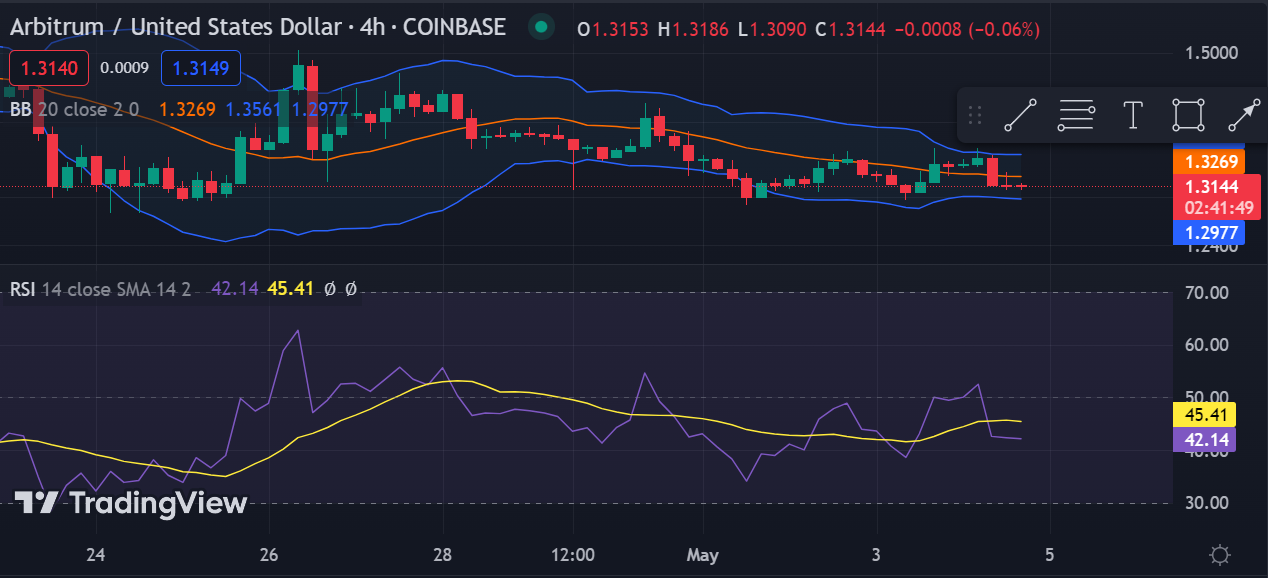
Arbitrum price analysis on the 4-hour chart shows the price of Arbitrum has experienced minimum changes, with the price trading within a tight range between $1.31 to $1.35. The Bollinger bands are seen to be narrow, indicating low volatility in the ARB/USD pair. The MACD and signal lines are both seen to be below the zero line, indicating a bearish momentum.

ARB/USD 4-hour price chart: TradingView
The technical analysis shows the altcoin has formed a descending triangle pattern, with the bears in control of the market. If the price breaks below $1.31, we could see a further drop toward the support level at $1.25. On the upside, if the price manages to break above the upper trend line at $1.40, then we may witness some bullish momentum and the price could reach the next resistance level at $1.50.
Arbitrum price analysis conclusion
The Arbitrum price analysis shows that the ARB token has failed to break above the EMA200 (1.40) and is heading towards its support level at $1.25. Bears remain adamant in pushing prices lower, with a bearish engulfing pattern seen on the daily chart. The technical analysis suggests ARB prices are currently in a consolidation phase and may be heading lower soon.


 Bitcoin
  Ethereum
  Tether
  USDC
USDC  TRON
TRON  Dogecoin
  Cardano
  Bitcoin Cash
  Chainlink
  LEO Token
  Monero
  Stellar
  Zcash
Zcash  Litecoin
  Hedera
  Dai
Dai  Cronos
  Tether Gold
  OKB
OKB  Ethereum Classic
  KuCoin
  Algorand
  Cosmos Hub
  Gate
Gate  VeChain
  Stacks
  Tezos
Tezos  TrueUSD
  Dash
Dash  IOTA
IOTA  Basic Attention
  Theta Network
  Decred
  NEO
NEO  Synthetix
  Qtum
Qtum  Ravencoin
  0x Protocol
  DigiByte
  Zilliqa
  Nano
Nano  Siacoin
  Numeraire
  Waves
Waves  Status
  Ontology
  Enjin Coin
  BUSD
BUSD  Hive
Hive  Pax Dollar
  Lisk
Lisk  Steem
Steem  Huobi
Huobi  OMG Network
  NEM
NEM  Bitcoin Gold
  Bitcoin Diamond
  Augur
Augur