ATOM Technical Analysis: Uncertainty Rises Above 200-Day EMA

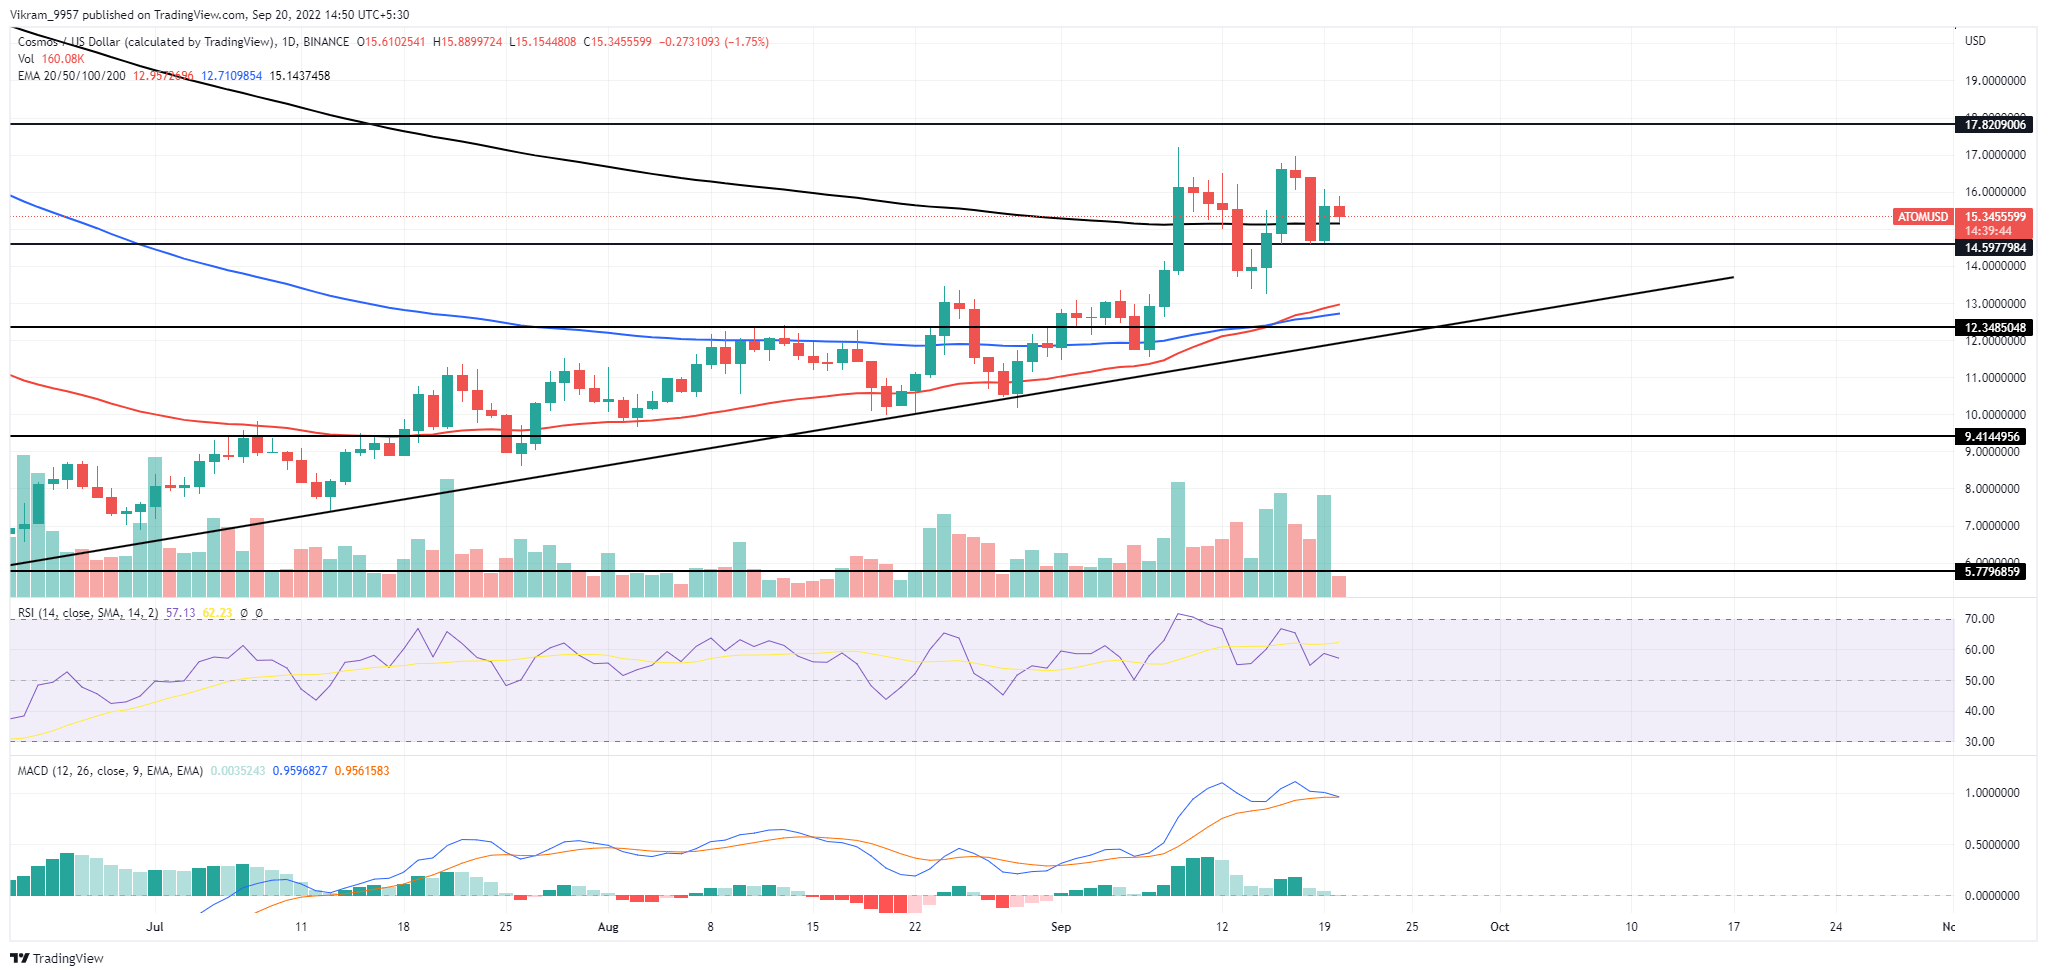
The ATOM technical analysis shows the buyers reclaiming dominance over the 200-day EMA and the $15 mark. But will the uptrend sustain this month? The ATOM price action bullish reversal rally from a long-coming support trendline in the daily chart resulting in a price jump above the 200-day EMA. Furthermore, the rise in intraday trading volume supports the bull cycle, projecting a potential trend continuation to $20. However, the increased selling pressure above the EMA warns of a downfall.
Key Points:
- The Cosmos prices show higher price rejection above the 200-day EMA.
- The market value sustains above the $15 mark for now.
- The intraday trading volume in Cosmos is $616 Million.

Source-Tradingview
ATOM Technical Analysis
The ATOM price displays a bullish reversal from the crucial daily support trendline resulting in a 48% jump over the past three weeks. The bullish rally beats the 50-day EMA and influences a crossover between the 50 and 100-day EMAs to regain positive alignment. However, the price faced increased selling pressure above the $15 mark resulting in a retracement to $14.5 twice this fortnight. Currently, the prices display a bullish attempt to sustain above the 200-day EMA and the $15 mark. With sustained selling, the ATOM price will tumble 13.2% and retest the neckline support of the double bottom pattern. A bearish breakdown from this support will accelerate the bearish momentum and offer a breakdown attempt from the long-coming support. However, until the ATOM price sustains above the rising trendline, the market participants can maintain a bullish outlook.
Technical Indicator
A bearish divergence in daily RSI slope bolsters the formation of a double bottom pattern, and its crossover below the mean line will encourage prolonged correction. Moreover, the bearish crossover between the MACD and signal lines signals a selling opportunity. Therefore, the technical indicators display a rising bearish sentiment. As a result, the ATOM technical analysis provides a selling opportunity. Resistance levels- $0.42 and $0.50 Support levels- $0.36 and $0.30


 Bitcoin
  Ethereum
  Tether
  USDC
USDC  TRON
TRON  Dogecoin
  Cardano
  Bitcoin Cash
  Chainlink
  LEO Token
  Stellar
  Monero
  Zcash
Zcash  Litecoin
  Hedera
  Dai
Dai  Cronos
  OKB
OKB  Tether Gold
  Ethereum Classic
  KuCoin
  Gate
Gate  Algorand
  Cosmos Hub
  VeChain
  Dash
Dash  Tezos
Tezos  Stacks
  TrueUSD
  IOTA
IOTA  Basic Attention
  Decred
  Theta Network
  NEO
NEO  Synthetix
  Qtum
Qtum  Ravencoin
  0x Protocol
  DigiByte
  Zilliqa
  Nano
Nano  Holo
Holo  Numeraire
  Siacoin
  Waves
Waves  Ontology
  Enjin Coin
  Status
  BUSD
BUSD  Pax Dollar
  Hive
Hive  Lisk
Lisk  Steem
Steem  Huobi
Huobi  NEM
NEM  OMG Network
  Augur
Augur  Bitcoin Gold
  Ren
Ren  Bitcoin Diamond