Biggest Movers: BCH Climbs to 1-Week High, DOT Declines

Bitcoin cash rose to a one-week high in today’s session, despite crypto markets mostly trading lower. The global cryptocurrency market cap is down by 2.45% as of writing, which comes as traders reacted to rising geopolitical tensions. Polkadot was a notable token to slip, as prices collided with a key support point.
Bitcoin Cash (BCH)
Bitcoin cash (BCH) raced to a one-week high on Wednesday, despite cryptocurrency markets mostly trading lower.
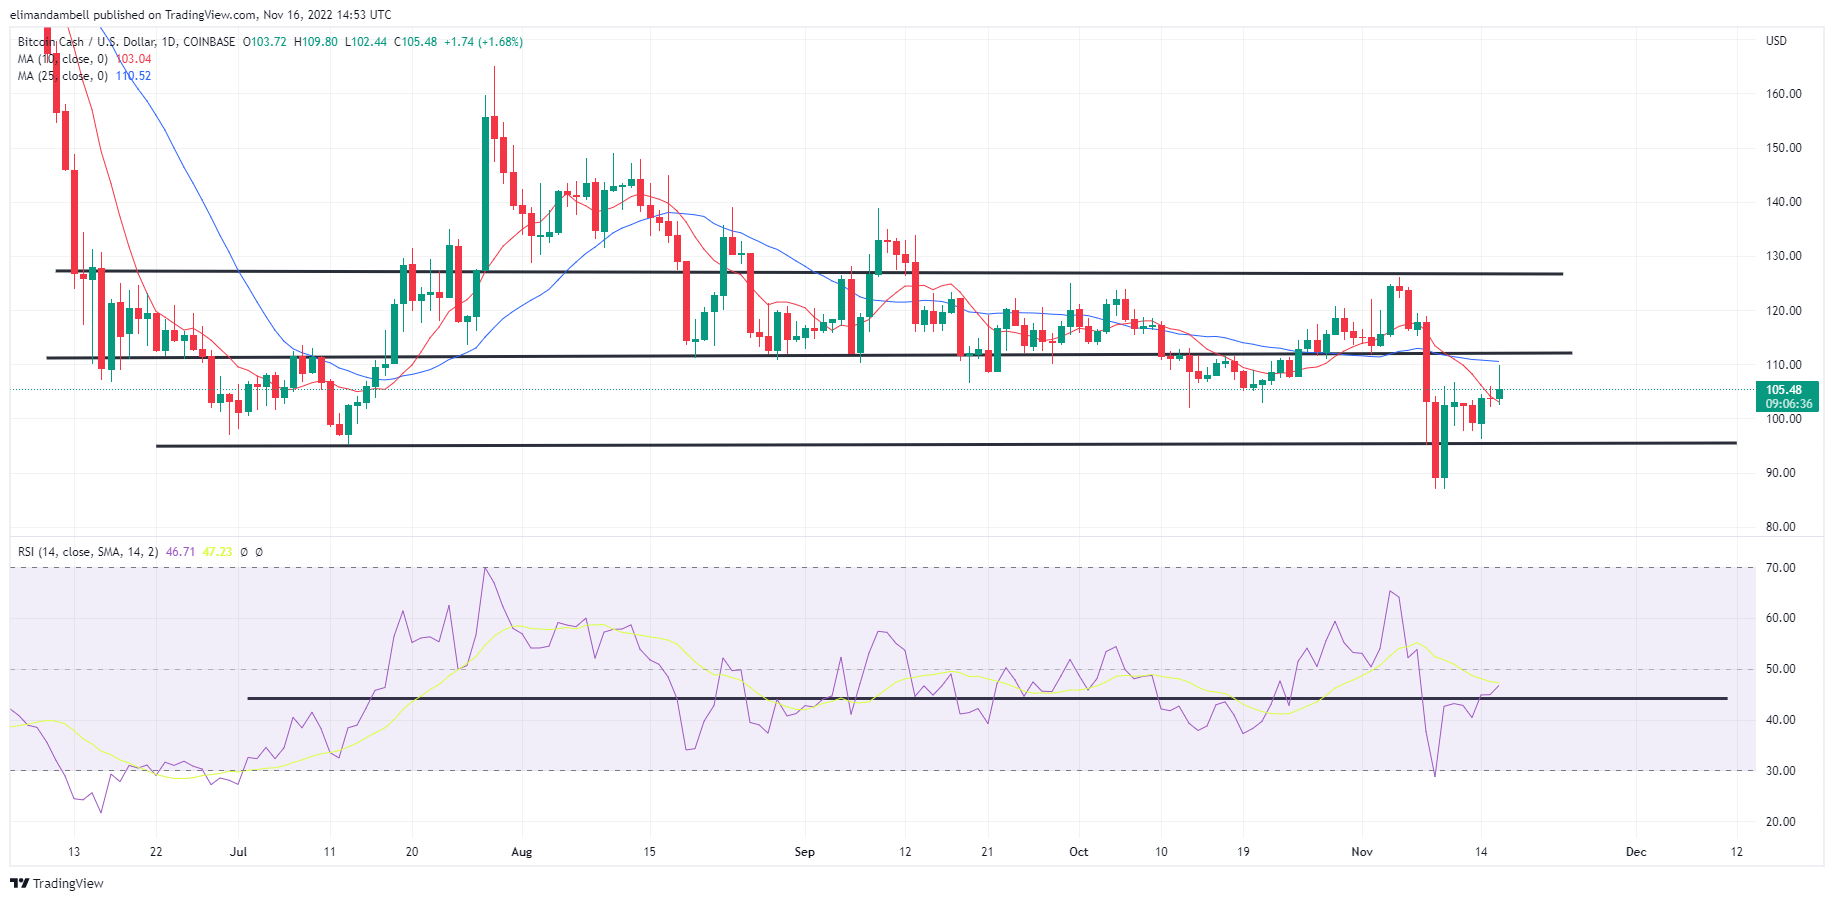
Following a low of $103.09 on Tuesday, BCH/USD surged to an intraday peak of $109.09 earlier in today’s session.
The move saw BCH hit its highest point since November 8, when the token was trading close to a high of $120.00.

BCH/USD – Daily Chart
As can be seen from the chart above, today’s high saw bitcoin cash move closer to a key resistance level of $110.00.
The 14-day relative strength index (RSI) also rose higher, with the index breaking out of a ceiling of its own.
Currently, the index is tracking at 46.52, which is above the aforementioned ceiling at 45.00.
Polkadot (DOT)
Polkadot (DOT) on the other hand was back in the red on Wednesday, snapping a two-day win streak in the process.
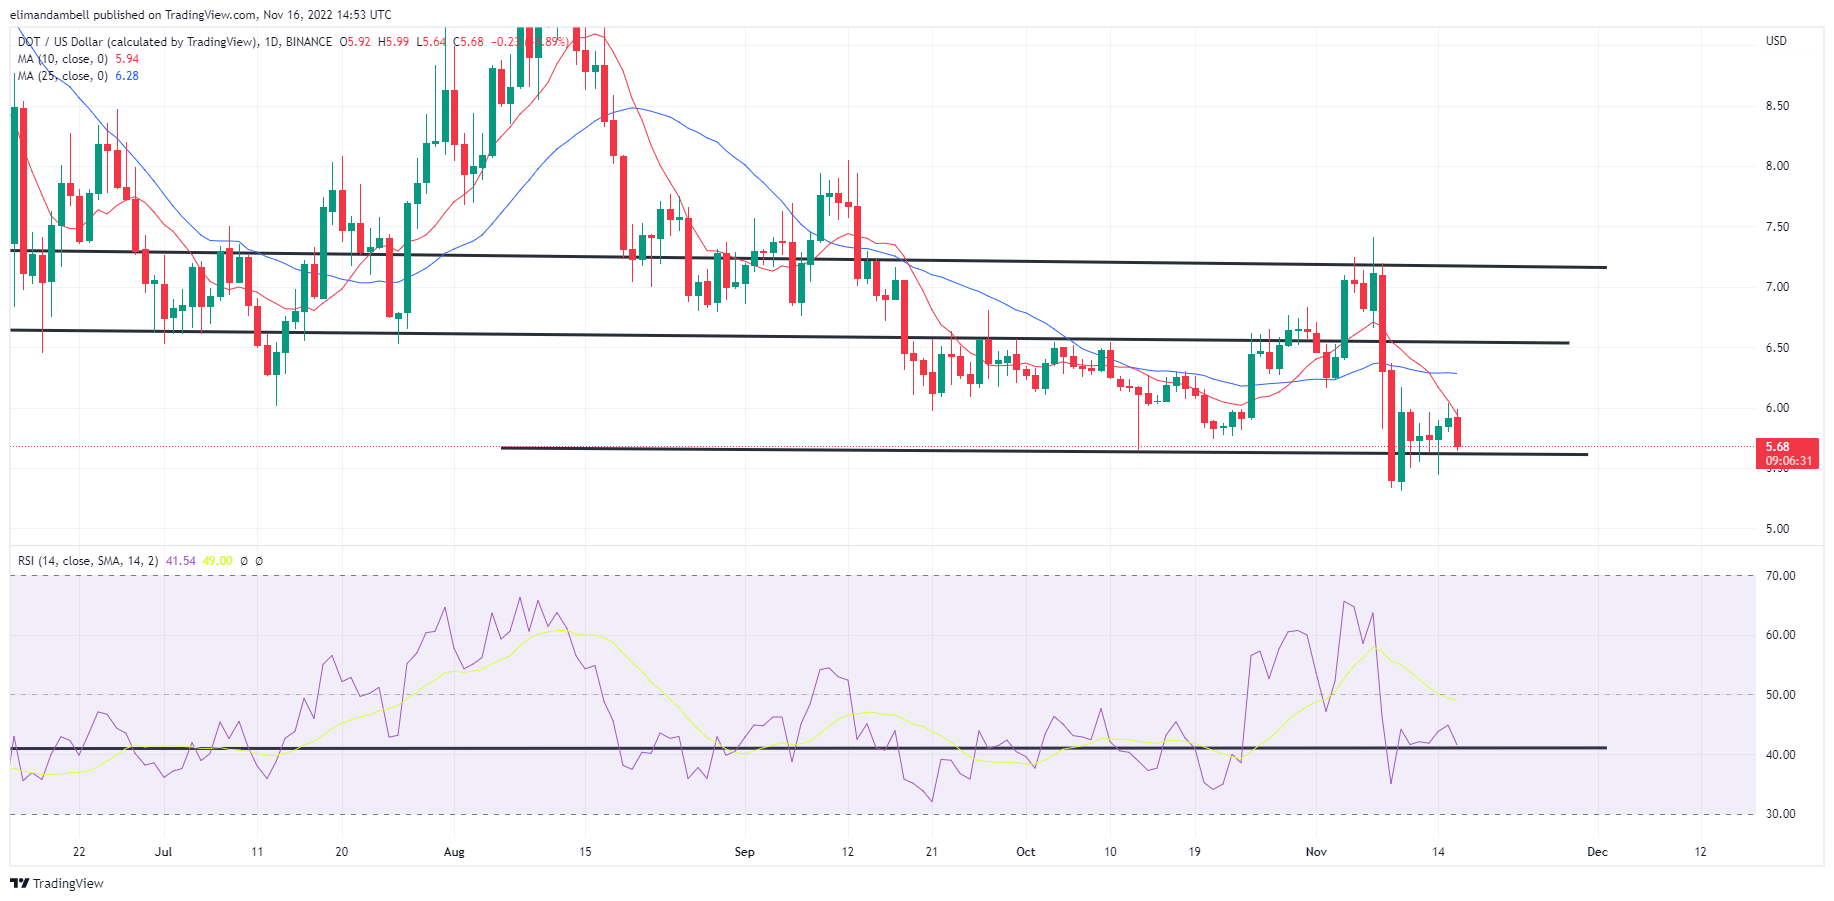
DOT/USD was down by as much as 5% in today’s session, falling to a low of $5.72.
Today’s drop saw the token move closer to its support level at $5.60, which has mostly been in place for the last week.

DOT/USD – Daily Chart
Looking at the chart, the RSI also dropped to a floor of its own, with the index colliding with its support at 41.00.
Should the index move below this point, we will likely see polkadot move towards $5.30, which would be a two-year low.
Traders will likely also be paying attention to the moving averages, as the indicator still looks positioned for further downward momentum.


 Bitcoin
  Ethereum
  Tether
  USDC
USDC  TRON
TRON  Dogecoin
  Cardano
  Bitcoin Cash
  Monero
  Chainlink
  LEO Token
  Stellar
  Zcash
Zcash  Litecoin
  Hedera
  Dai
Dai  Cronos
  OKB
OKB  Tether Gold
  Ethereum Classic
  KuCoin
  Cosmos Hub
  Gate
Gate  Algorand
  Dash
Dash  VeChain
  Tezos
Tezos  Stacks
  TrueUSD
  Decred
  IOTA
IOTA  Theta Network
  Basic Attention
  NEO
NEO  Synthetix
  Qtum
Qtum  0x Protocol
  DigiByte
  Ravencoin
  Zilliqa
  Nano
Nano  Siacoin
  Numeraire
  Waves
Waves  Enjin Coin
  Ontology
  Status
  BUSD
BUSD  Hive
Hive  Pax Dollar
  Lisk
Lisk  Steem
Steem  Huobi
Huobi  OMG Network
  Bitcoin Gold
  NEM
NEM  Augur
Augur