Binance Coin Price Prediction: A 2-day reversal pattern spelling bad news

- Binance Coin price has printed a shooting star pattern on the 2-day chart.
- BNB price is finding resistance from the 8-day exponential moving average.
- Invalidation of the bearish thesis could occur if the bulls hurdle the $290 level and find stable support.
Binance Coin price shows reasons to believe in another selloff. Key levels have been identified.
Binance Coin price could fall once more
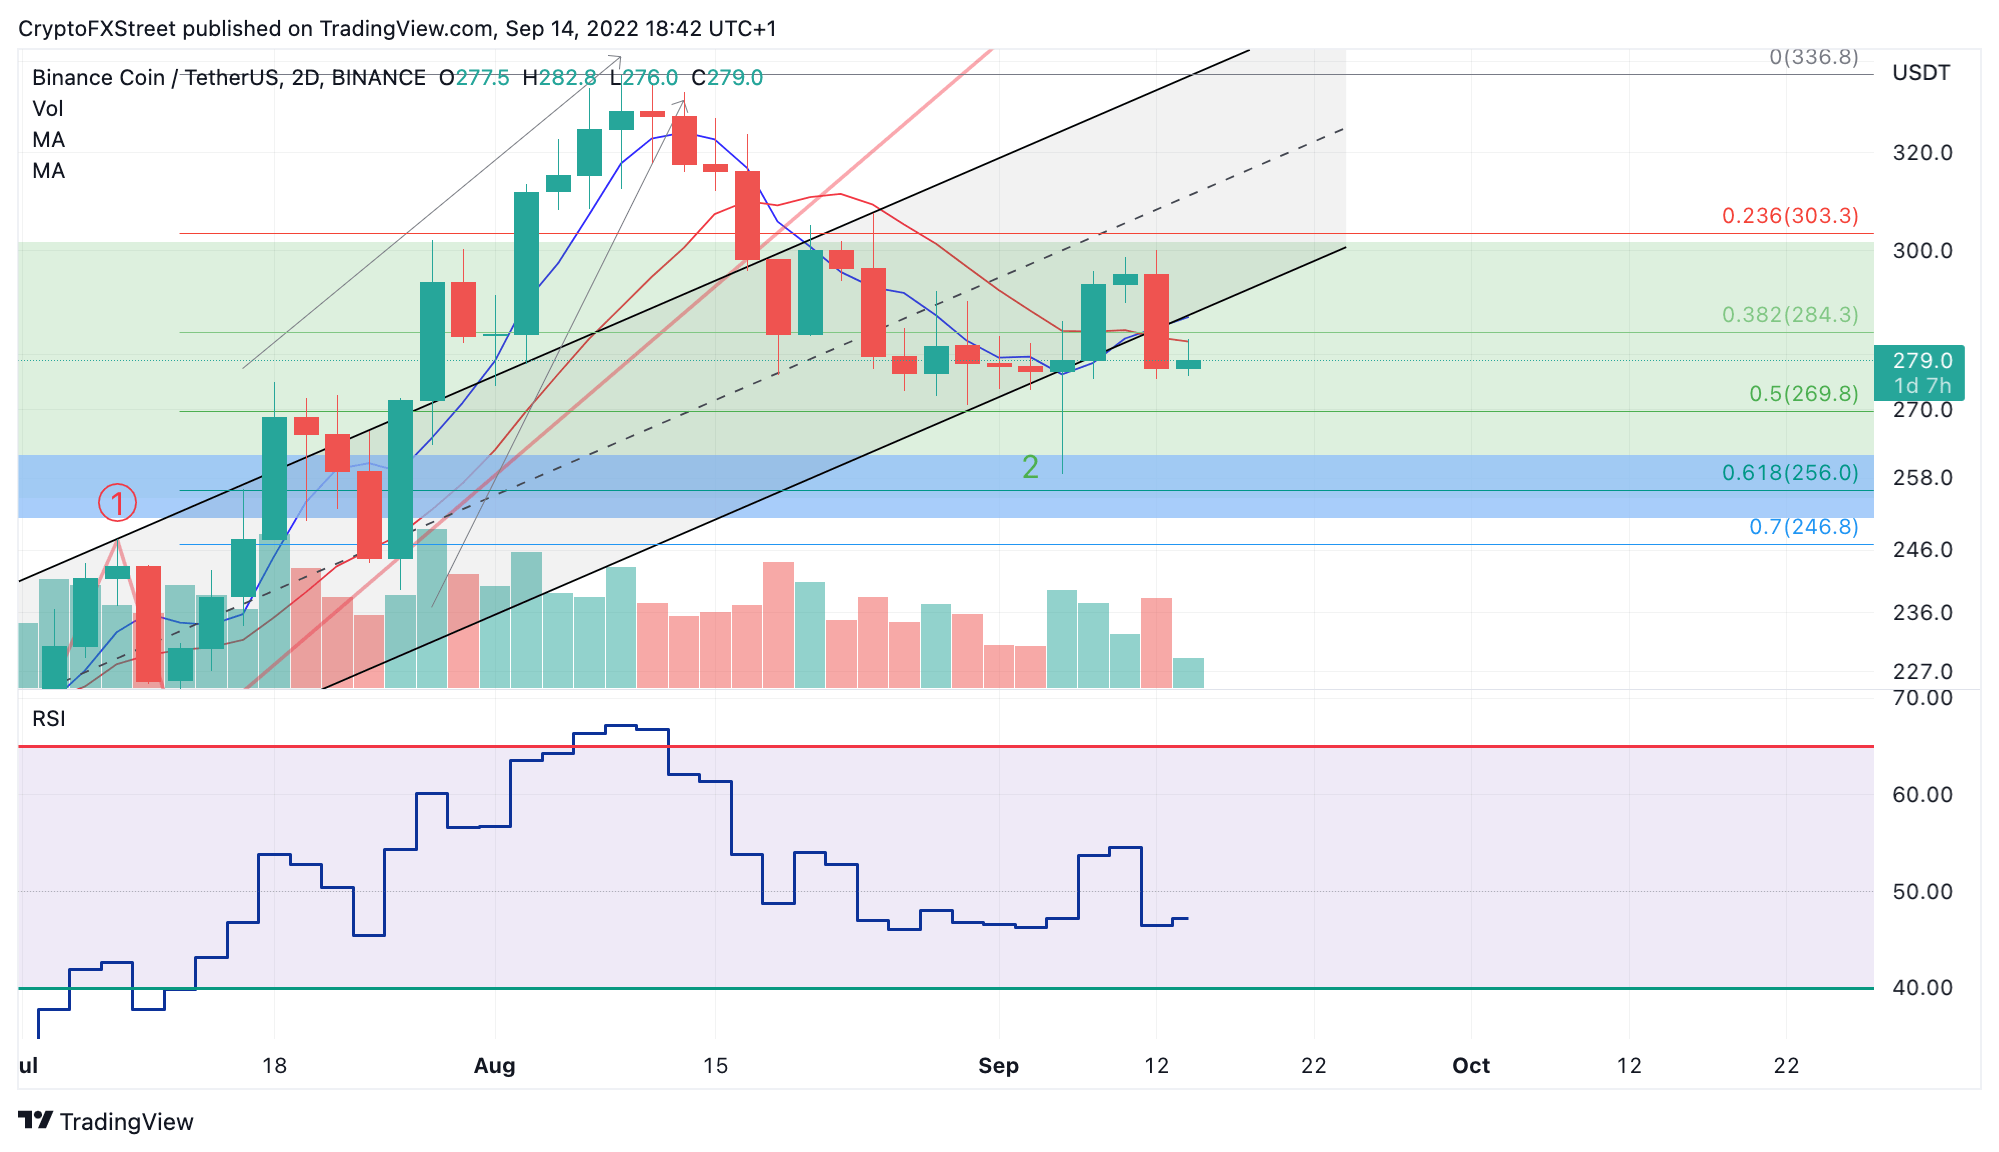
Binance Coin price warrants concern as the most recent selloff shows a classic reversal pattern within the price action. Binance Coin price lost 7% of market value amidst the most recent selloff. A bearish engulfing candle was established on the 2-day chart, which finalizes a much larger shooting star reversal pattern. Amongst price action traders, this pattern is a “get out of the way signal,” expressing more losses could ensue.
Binance Coin price currently auctions at $279. The bears are flexing their grip as the bulls have lost support from both the 8-day exponential moving average and the 21-day simple moving average. The Relative Strength index (RSI) still hovers in supportive territory but has about 16% of cushion space. Translating the RSI reading into the current market value, the BNB price could fall to the $233 level if market conditions persist.

BNB USDT 2-Day Chart
Invalidation of the bearish thesis could occur if the bulls reconquer both moving averages. A closing 2-day candle above $290 could prompt a countertrend rally towards the summertime high at $336.8. Such a move would result in a 20% increase from the current Binance Coin price.
In the following video, our analysts deep dive into the price action of Binance Coin, analyzing key levels of interest in the market.


 Bitcoin
  Ethereum
  Tether
  USDC
USDC  TRON
TRON  Dogecoin
  Cardano
  Bitcoin Cash
  Monero
  Chainlink
  LEO Token
  Stellar
  Zcash
Zcash  Litecoin
  Hedera
  Dai
Dai  Cronos
  Tether Gold
  OKB
OKB  Ethereum Classic
  KuCoin
  Gate
Gate  Cosmos Hub
  Algorand
  Dash
Dash  VeChain
  Tezos
Tezos  Stacks
  TrueUSD
  Decred
  IOTA
IOTA  Theta Network
  Basic Attention
  NEO
NEO  Synthetix
  Qtum
Qtum  DigiByte
  0x Protocol
  Ravencoin
  Zilliqa
  Nano
Nano  Siacoin
  Holo
Holo  Numeraire
  Waves
Waves  Enjin Coin
  Ontology
  Status
  BUSD
BUSD  Hive
Hive  Pax Dollar
  Lisk
Lisk  Steem
Steem  Huobi
Huobi  OMG Network
  Bitcoin Gold
  NEM
NEM  Augur
Augur