BNB Technical Analysis: Buying Spree Ready To Cross $300

The BNB price shows a bullish breakout of a rising channel pattern with increased demand. Will this breakout rally reach $350?
Key Technical Points:
- The BNB prices jumped by 3.73% in the last 24 hours.
- The price action displays a bearish opposition from the $290 mark.
- The 24-hour trading volume of Binance is $2.77 billion, indicating a hike of 64.88%.
Past Performance of BNB
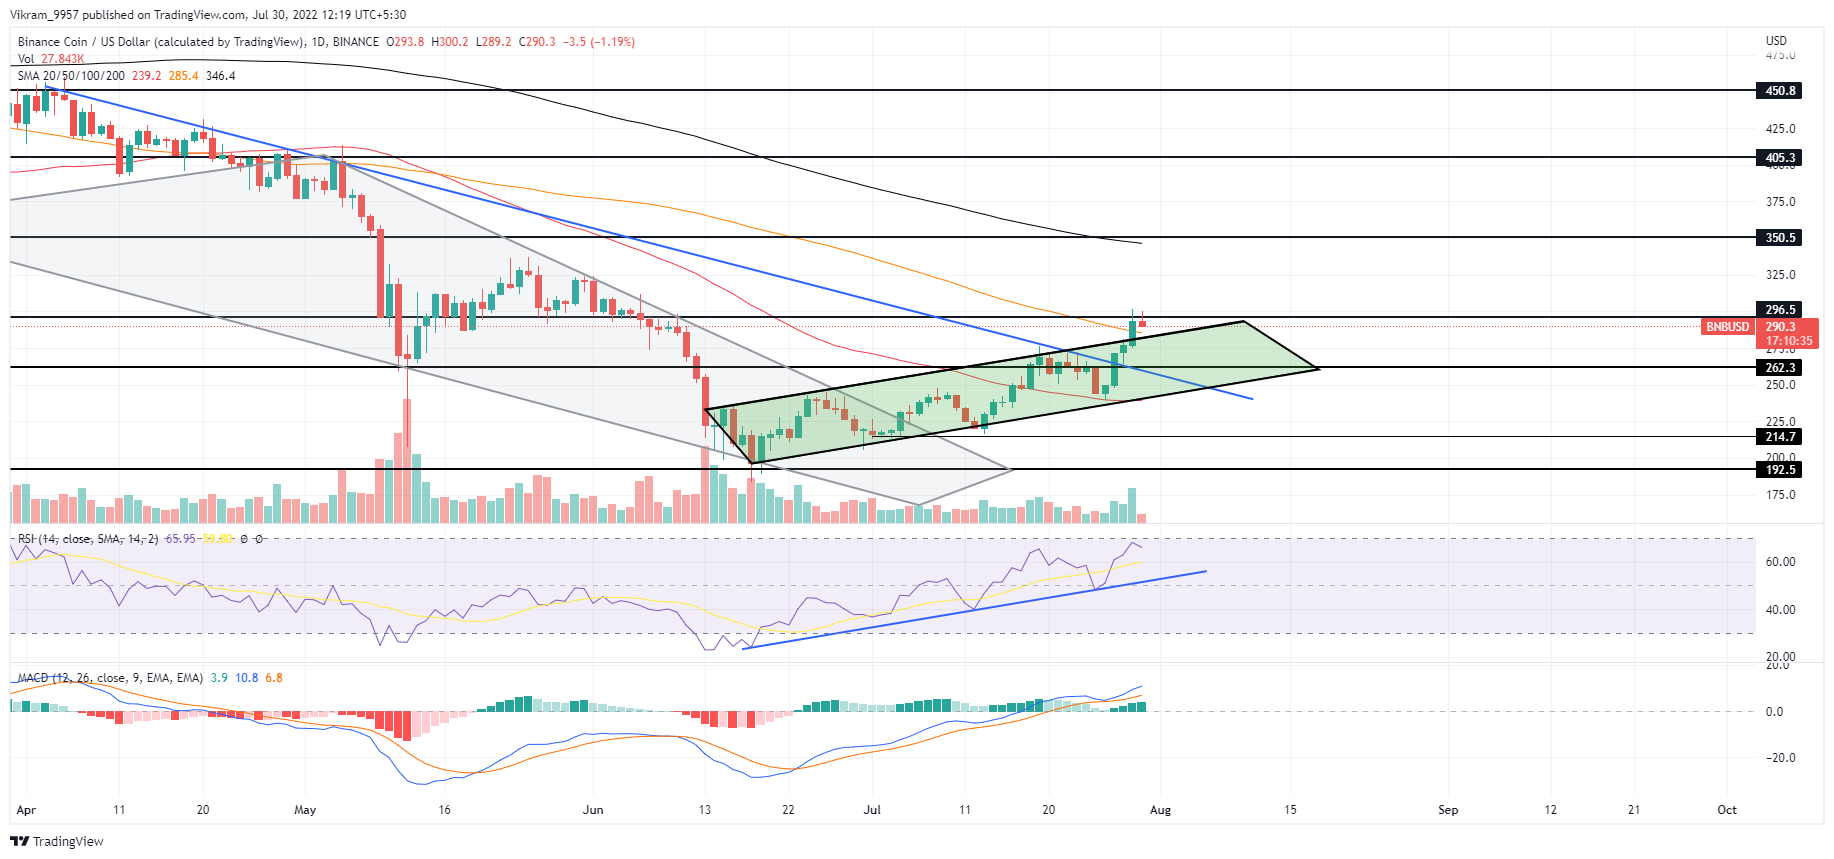
As mentioned in our previous analysis, the BNB price action breaks the bearish influence of a resistance trend line at $265. The breakout rally continues within the rising channel before breaching the 100-day SMA resulting in the bullish breakout of the said pattern. The breakout rally, however, shows higher price rejection from the psychological mark of $300, projecting a potential retracement to retest the bullish breakout.

Source — Tradingview
BNB Technical Analysis
The bullish break out of the rising channel pattern shows an increase in trading volume, projecting a high likelihood of an uptrend continuation. Hence traders can expect the BNB prices to exceed the psychological mark of $300 after a successful post-retest reversal. As mentioned before, the bull run exceeds the 100-day SMA after a bullish reversal from the 50 Day SMA. Hence the increasing bullish influence over the SMAs projects a high likelihood of a bullish turnaround that may lead to crossover events. The daily RSI slope sustains above the support trendline and reaches the overbought boundary, reflecting an increase in the underlying bullishness. The MACD indicator displays the rising bullish histograms helping the fast and slow lines avoid a bearish crossover event. Hence the technical indicator reflects an increase in buying pressure that may continue above the $300 mark. In a nutshell, the BNB Technical Analysis projects a breakout entry spot as the prices retest the 100-day SMA.
Upcoming Trend
If the BNB prices show successful post-retest reversal from the 100 Day SMA, the bull run could exceed $300. Traders can expect the breakout rally to reach the next resistance level at $350. Conversely, increasing selling pressure during the retests may drive the prices under the 100-day SMA and trap the price trend within the rising channel pattern once again. Resistance Levels: $300 and $350 Support Levels: 100-day SMA and $265


 Bitcoin
  Ethereum
  Tether
  USDC
USDC  TRON
TRON  Dogecoin
  Cardano
  Bitcoin Cash
  Chainlink
  Monero
  LEO Token
  Stellar
  Zcash
Zcash  Litecoin
  Hedera
  Dai
Dai  Cronos
  Tether Gold
  OKB
OKB  Ethereum Classic
  KuCoin
  Gate
Gate  Algorand
  Cosmos Hub
  VeChain
  TrueUSD
  Dash
Dash  Tezos
Tezos  Stacks
  IOTA
IOTA  Basic Attention
  Theta Network
  Decred
  NEO
NEO  Synthetix
  Qtum
Qtum  Ravencoin
  DigiByte
  0x Protocol
  Nano
Nano  Zilliqa
  Siacoin
  Numeraire
  Waves
Waves  BUSD
BUSD  Status
  Pax Dollar
  Enjin Coin
  Ontology
  Hive
Hive  Lisk
Lisk  Steem
Steem  Huobi
Huobi  OMG Network
  NEM
NEM  Bitcoin Gold
  Augur
Augur  HUSD
HUSD  Ren
Ren