BNB Technical Analysis: Will Binance Coin Sustain the Bull Cycle?

The BNB technical analysis displays a continuation of the bullish trend with high buying pressure in the market as RSI hit the overbought boundary. Despite falling around 13.56% in the last 7 days due to the bearish trend in the market caused by FTX financial crises, Binance Coin (BNB) grew 3.88% in the last 24 hours touching the daily high of $290.72 rebounding from the daily low of $268.23. Although BNB plunged to its 3-month low of $263.08 this week, BNB has managed to deliver relatively better returns as compared to other crypto markets with 3.63% growth in the last month regaining $10.16 points. The 3.92% rise in 24-hour market cap to 44.73 billion and 29.56% increase in trading volume to $1.5 billion support a strong bullish cycle in the BNB market.
Key Points
- The BNB price action shows an uptrend with higher price rejection candles
- BNB price actions maintain bullish momentum
- The intraday trading volume in BNB is $487.98 million

Source Tradingview
BNB Technical Analysis
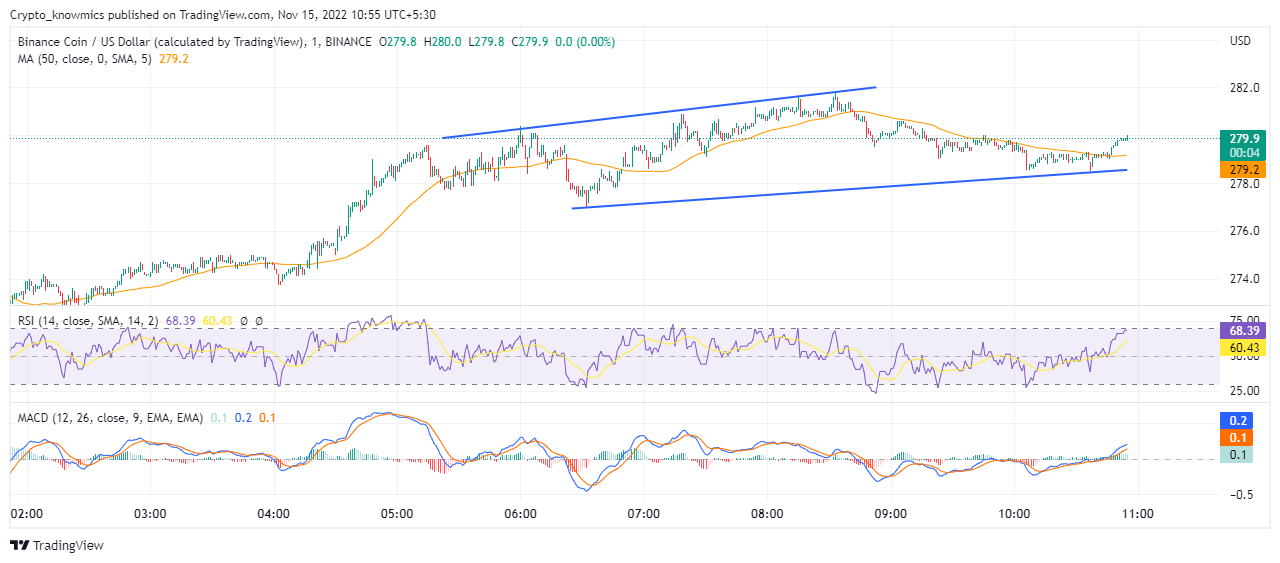
In our previous analysis, BNB price actions displayed a downtrend with increased selling pressure. However, today BNB price actions have been able to maintain a bullish trend with increased buying pressure. The 50-day SMA confirms the bullish rally in the market, as it supports the support level in the uptrend and the resistance level in the downtrend. Currently, trading at $279.79 BNB forecast an uptrend with an intraday rise of over 3%. If buying pressure persists the BNB prices may break above the physiologically important mark of $300. However, if BNB fails to maintain the bull momentum, the prices may fall below $260 putting the $250 mark to test.
Technical Indicators
RSI makes a bullish divergence before touching the overbought boundary of 70% moving above the 14-day SMA, showing high buying pressure as bullish sentiments prevail in the market. As the histogram continues to be bullish, MACD makes a bullish crossover while moving above the halfway line. The technical indicators display a bullish rally in the market with increasing buying pressure and with the possibility of another bullish breakout for intraday buyers.


 Bitcoin
  Ethereum
  Tether
  USDC
USDC  TRON
TRON  Dogecoin
  Cardano
  Bitcoin Cash
  Monero
  Chainlink
  LEO Token
  Stellar
  Zcash
Zcash  Litecoin
  Hedera
  Dai
Dai  Cronos
  Tether Gold
  OKB
OKB  Ethereum Classic
  KuCoin
  Gate
Gate  Cosmos Hub
  Dash
Dash  Algorand
  VeChain
  Tezos
Tezos  Stacks
  TrueUSD
  Decred
  IOTA
IOTA  Theta Network
  Basic Attention
  NEO
NEO  Synthetix
  Qtum
Qtum  DigiByte
  Ravencoin
  0x Protocol
  Zilliqa
  Nano
Nano  Siacoin
  Numeraire
  Waves
Waves  Enjin Coin
  Ontology
  Status
  BUSD
BUSD  Hive
Hive  Pax Dollar
  Lisk
Lisk  Steem
Steem  Huobi
Huobi  OMG Network
  Bitcoin Gold
  NEM
NEM  Augur
Augur