


TON Price Analysis: Will The TON Price Surrender To Bears?

- 1 TON’s price is currently trading at $1.896 while seeing a change of 4.60% in 24-hour trading volume.
- 2 TON’s price recorded a decline of 0.43% in the last 24 hours.
The TON price is currently observing strong selling pressure. The price is seeing a decline of more than 10% within the last 7 days. It recently made a breakdown through its major support level near the 200 EMA where it gave a first close below it within the last 7 months. This is a major indication of a change in trend. Investors may remain cautious regarding the current trend as the price may experience some volatility before the trend reversal.
The technical indicators are supporting the sellers which indicates that the price of TON may continue to move in a bearish trend. The 50 EMA is crossing below 100 EMA giving a death cross; the RSI line has been making lower high and lower low patterns since early December.
TON Price Makes a Bearish Engulfing Candle
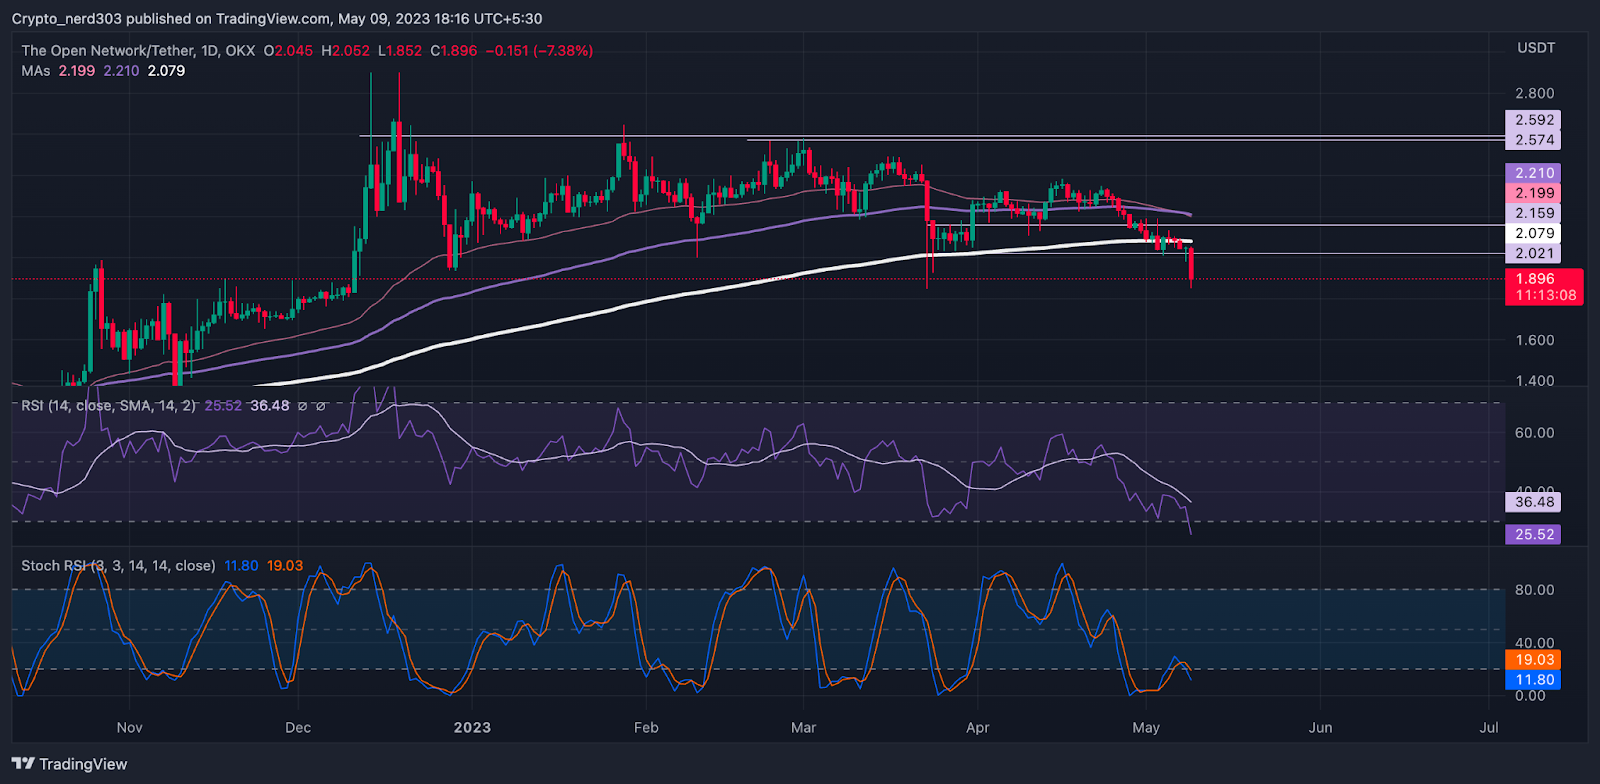
Source: TON/USDT by TradingView
Previously, it was suggested that as the TON price is trading near the neck level of its previous high the price can make a bearish reversal. The Oscillators were also taking a reversal from the overbought levels. The analysis was proven correct when after a rejection the price took a correction of more than 10% breaking below all of its major support levels.
The market sentiments are observing a major decline since the last week, according to the greed and fear index, provided by the Alternative (dot) me platform. The current value of market sentiments in the greed and fear index is 51 points. It is seeing a decrease of 13 points within a short span of time where the sentiments were at 64.
Most of the cryptocurrency exchanges are currently witnessing a fierce struggle between the buyers and sellers where the buyers hold prominence within some exchanges. The buyers are dominating 71% of the market within a few exchanges.
Technical Analysis of the Tron Price
Source: TON/USDT by TradingView
The RSI line is currently trading near the critical oversold levels. The current value of RSI is 25.52 point’s which is trading below the 14 SMA. The current value of 14 SMA is 36.58 points.
The Stochastic RSI is trading near the oversold levels while the %K and %D lines are providing a bearish crossover near 20 points. The current value of stochastic RSI is 11.80 points.
Conclusion
According to the analysis, the price of TRX is giving ominous indications regarding the future trend on the contrary the Ocilators are suggesting a retest before the continuation of bear trend.
Technical levels –
Support -$2.100
Resistance – $1.700
Disclaimer
The views and opinions stated by the author, or any people named in this article, are for informational purposes only, and they do not establish financial, investment, or other advice. Investing in or trading crypto assets comes with a risk of financial loss.


 Bitcoin
  Ethereum
  Tether
  USDC
USDC  Dogecoin
  Cardano
  Bitcoin Cash
  Polygon
  Litecoin
  LEO Token
  Hedera
  Cosmos Hub
  Stellar
  OKB
OKB  Maker
Maker  Algorand
  NEO
NEO  Gate
Gate  KuCoin
  Synthetix Network
  IOTA
IOTA  Tether Gold
  TrueUSD
  Enjin Coin
  Ravencoin
  Holo
Holo  Siacoin
  0x Protocol
  Basic Attention
  Zcash
Zcash  Decred
  Lisk
Lisk  Ontology
  Waves
Waves  DigiByte
  Numeraire
  Pax Dollar
  Status
  Nano
Nano  Steem
Steem  OMG Network
  BUSD
BUSD  Ren
Ren  Bytom
Bytom  Bitcoin Diamond
  Augur
Augur  Energi
  HUSD
HUSD