


Calm Before the Storm? Ethereum Consolidates Below Resistance (ETH Price Analysis)
Ethereum has recently initiated a push and is currently confronting a significant resistance region. The price is consolidating, but a few other resistance levels could affect the short-term market outcome.
Technical Analysis
By Shayan
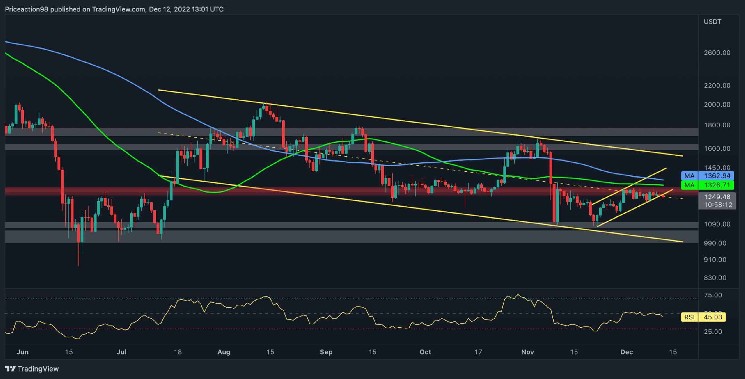
The Daily Chart
The 100-day and 50-day moving averages, standing at $1360 and $1320, prevent Ethereum’s price from going forward as it is currently consolidating below these levels with low volatility.
A static resistance level at $1300 has been pushing the price down over recent months. The price has also formed a descending price channel and is currently attempting to break the middle trendline.
In light of these considerations, the $1300-$1400 price region is currently the most vital resistance area, and a valid breakout should return the bullish sentiment and result in a fresh price spike.

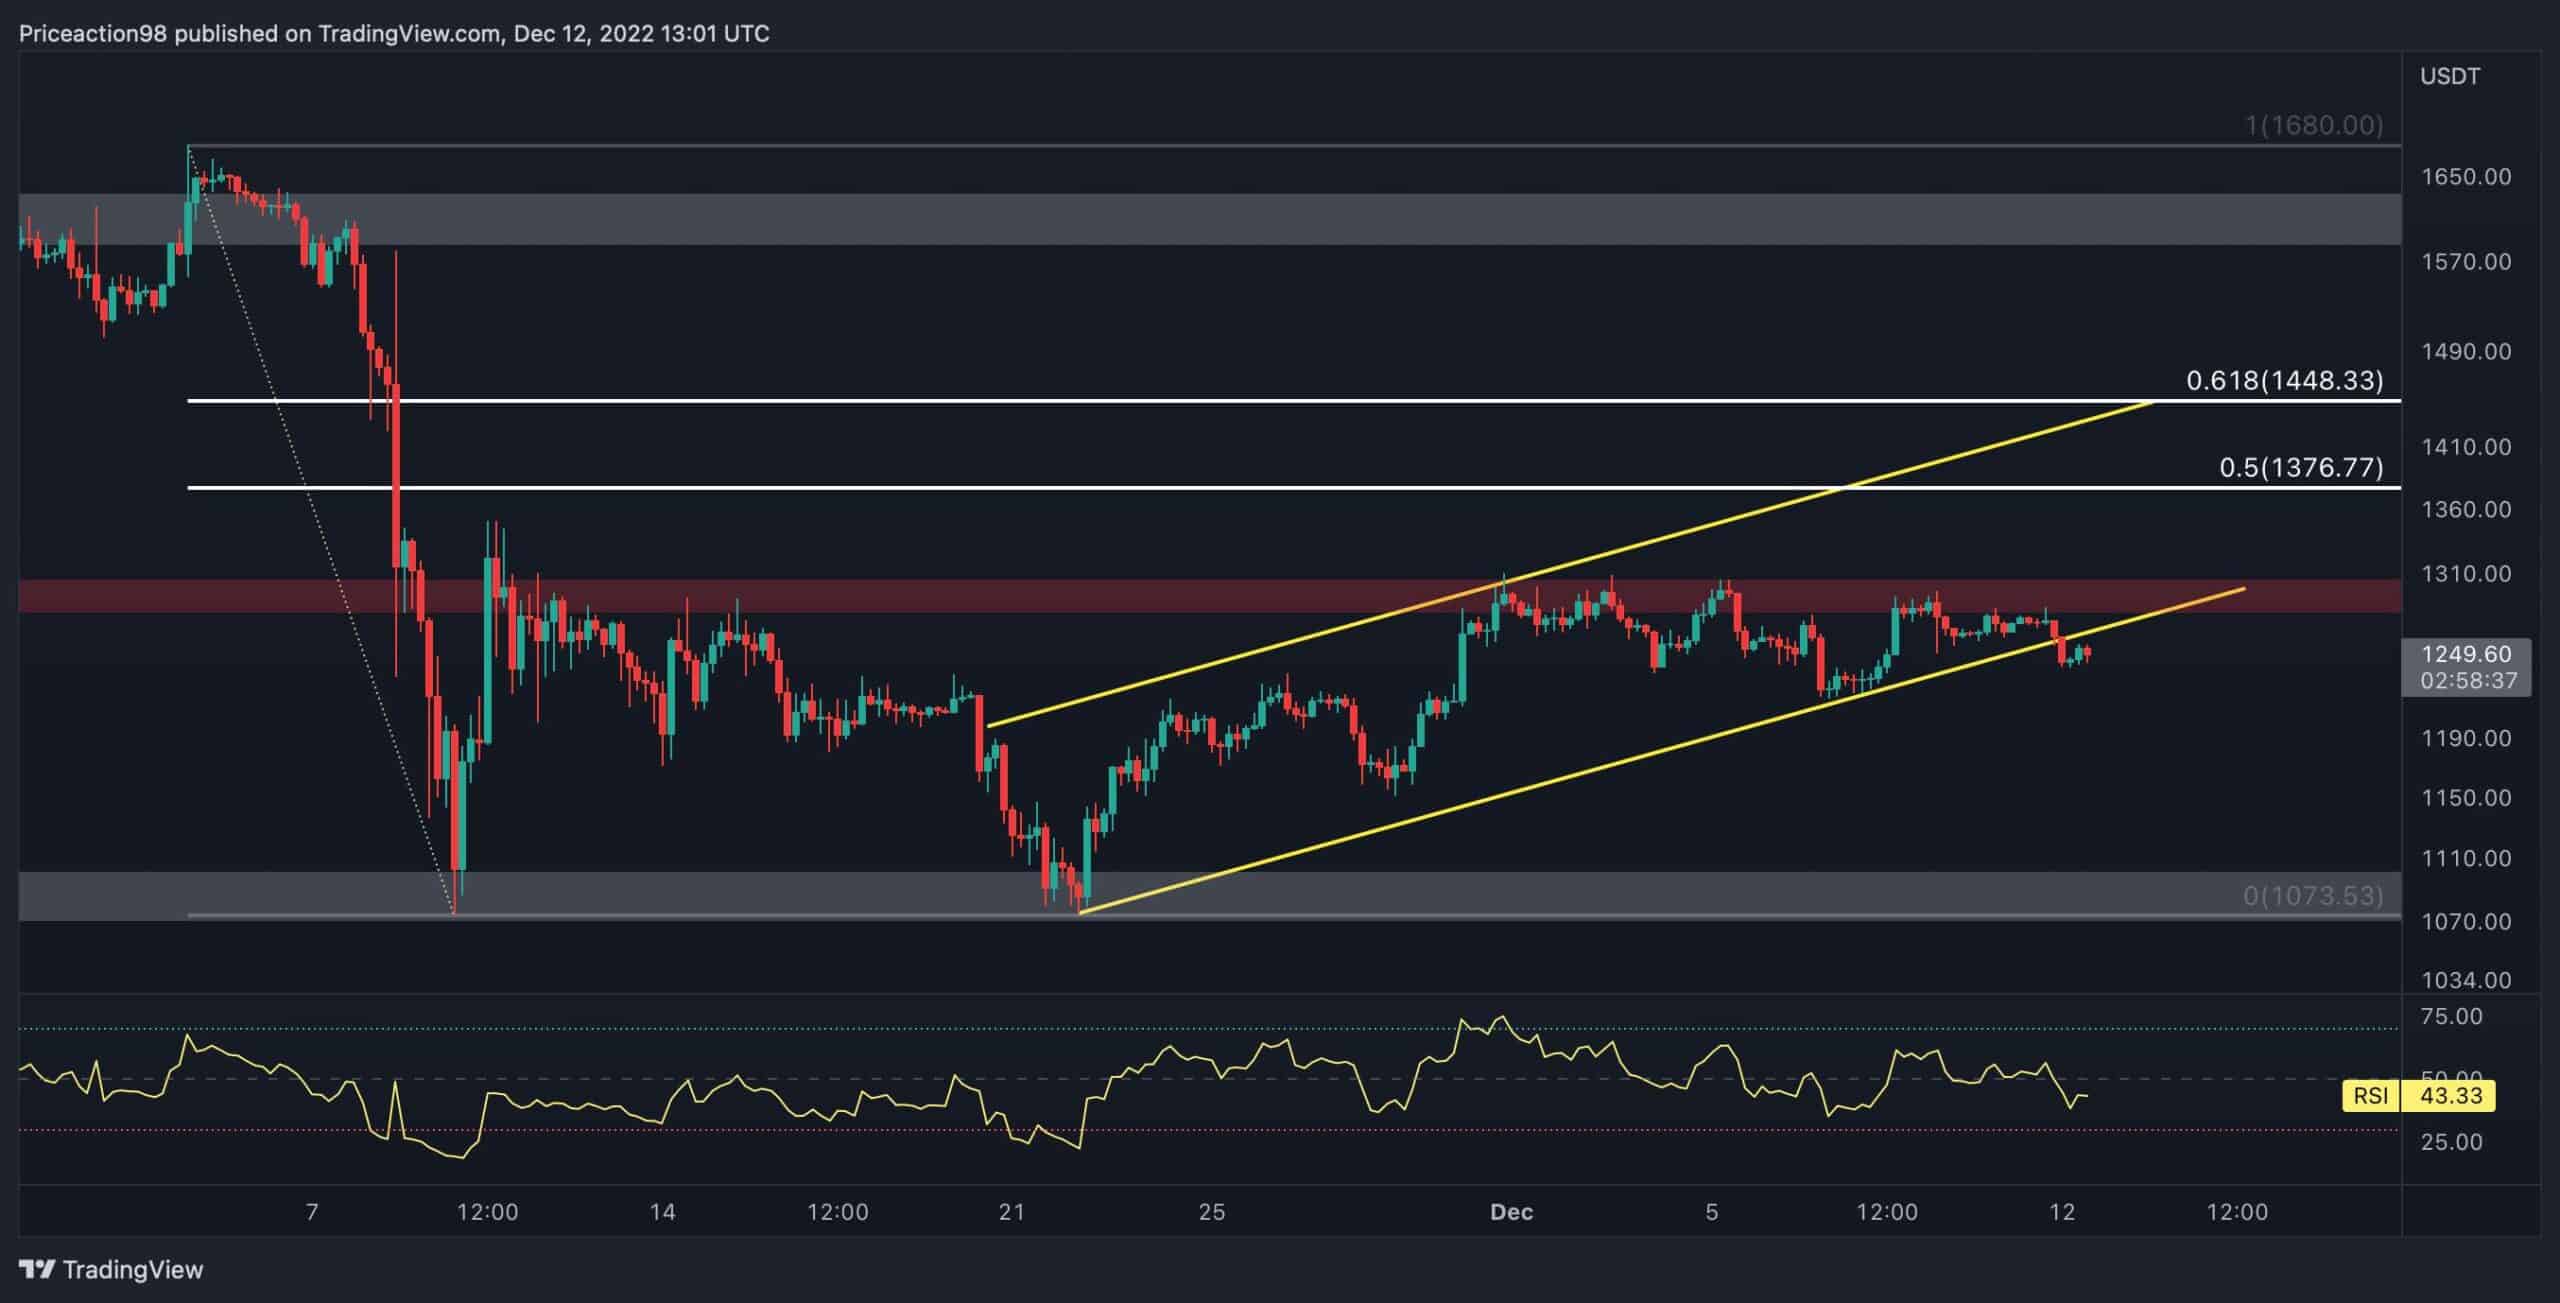
The 4-Hour Chart
On the 4-hour chart, the price has broken below the ascending channel that has been forming recently. The ascending channel is a well-known bearish reversal pattern and could result in a decline if the price fails to break back inside it in the coming days.
On the other hand, the price is facing a static resistance level of around $1300. If it breaks that level, the 0.5 and 0.618 Fib would be the next in line. These usually serve as powerful resistance in bearish trends and have the potential to halt the rally.
Overall, the market is facing a concerning lack of demand, which increases the chances of a bearish reversal at the current level and a plunge toward the $1K level.


 Bitcoin
  Ethereum
  Tether
  USDC
USDC  Dogecoin
  Cardano
  Bitcoin Cash
  Polygon
  Litecoin
  LEO Token
  Hedera
  Cosmos Hub
  Stellar
  OKB
OKB  Maker
Maker  Algorand
  Gate
Gate  NEO
NEO  KuCoin
  Synthetix Network
  IOTA
IOTA  Tether Gold
  TrueUSD
  Enjin Coin
  Siacoin
  Holo
Holo  0x Protocol
  Ravencoin
  Basic Attention
  Zcash
Zcash  Decred
  Lisk
Lisk  Ontology
  Waves
Waves  DigiByte
  Numeraire
  Pax Dollar
  Nano
Nano  Status
  Steem
Steem  OMG Network
  BUSD
BUSD  Ren
Ren  Bytom
Bytom  Bitcoin Diamond
  Augur
Augur  Energi
  HUSD
HUSD