Cardano Might Turn Around If It Moves Above These Two Levels

Cardano’s price remained bearish at the time of writing. The altcoin has been on a downtrend for quite some time now. Over the last 24 hours, ADA fell by 3%, and in the past week, it depreciated in double digits.
The 11% decline on the weekly chart has made ADA lose some important price floors. The technical outlook for the altcoin also pointed towards intense bearish strength. For the altcoin to recover, it must breach its immediate resistance over the subsequent trading sessions.
Related Reading: Bitcoin Miner Reserve Plunges, Bearish Sign For Price?
The buying strength for the altcoin has remained significantly low since the beginning of March. Demand for ADA was also low, signifying that accumulation declined.
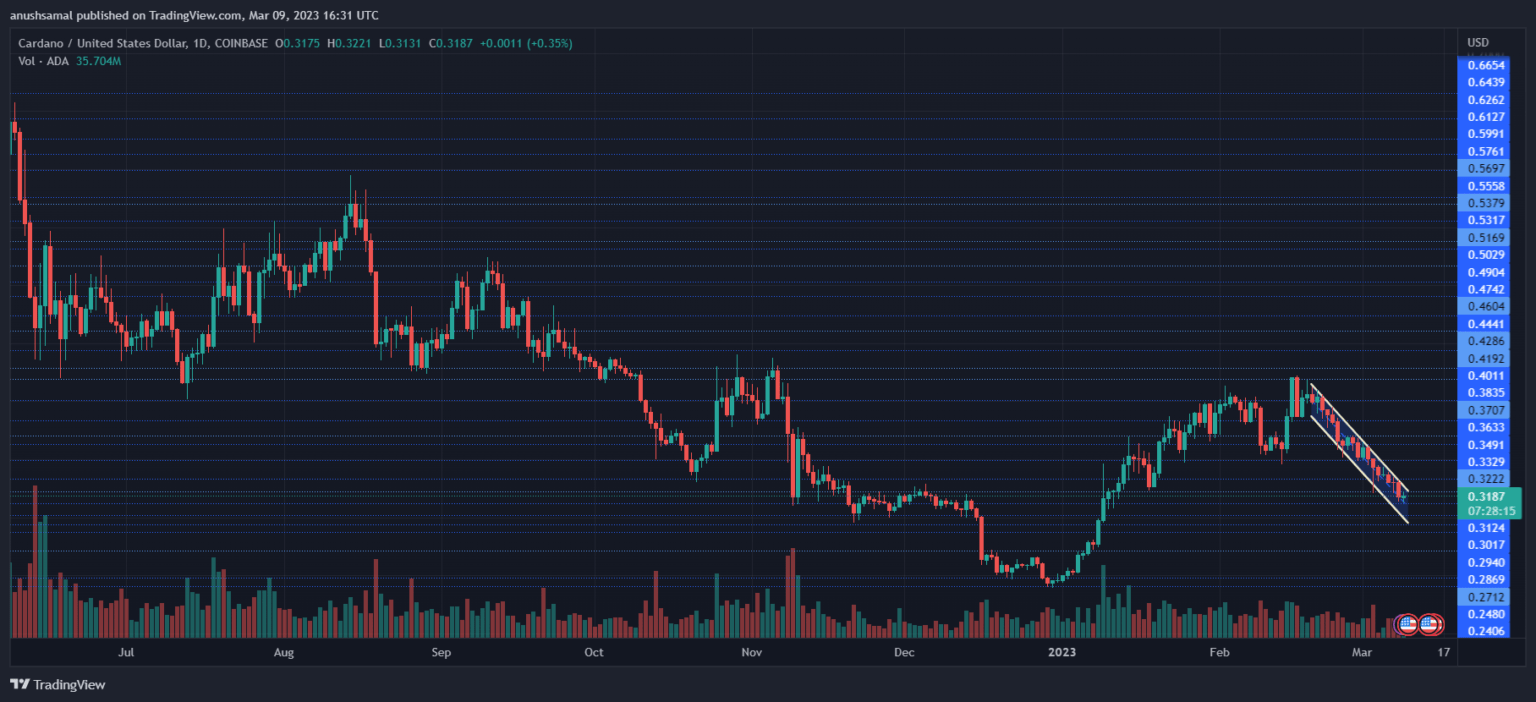
ADA’s market capitalization dropped, suggesting low buying strength in the market. ADA was trading within a descending channel, and its price direction is undecided, so it is uncertain how soon it can expect a recovery. There are two vital levels that the altcoin has to breach past for the price to move upwards.
Cardano Price Analysis: One-Day Chart

ADA was trading at $0.31 at the time of this writing. The altcoin witnessed considerable resistance at the $0.33 level; if it topples above that mark, the coin can start to recover. ADA’s two important resistance marks stood at $0.34 and $0.38.
Breaching the $0.38 mark will activate bullish momentum. The next ceiling would then rest at $0.43. On the other hand, if Cardano slips any further, the next stop for that would be at $0.29.
Falling below $0.29 will bring the coin to $0.27. The amount of ADA traded in the last session was red, indicating selling strength.
Technical Analysis

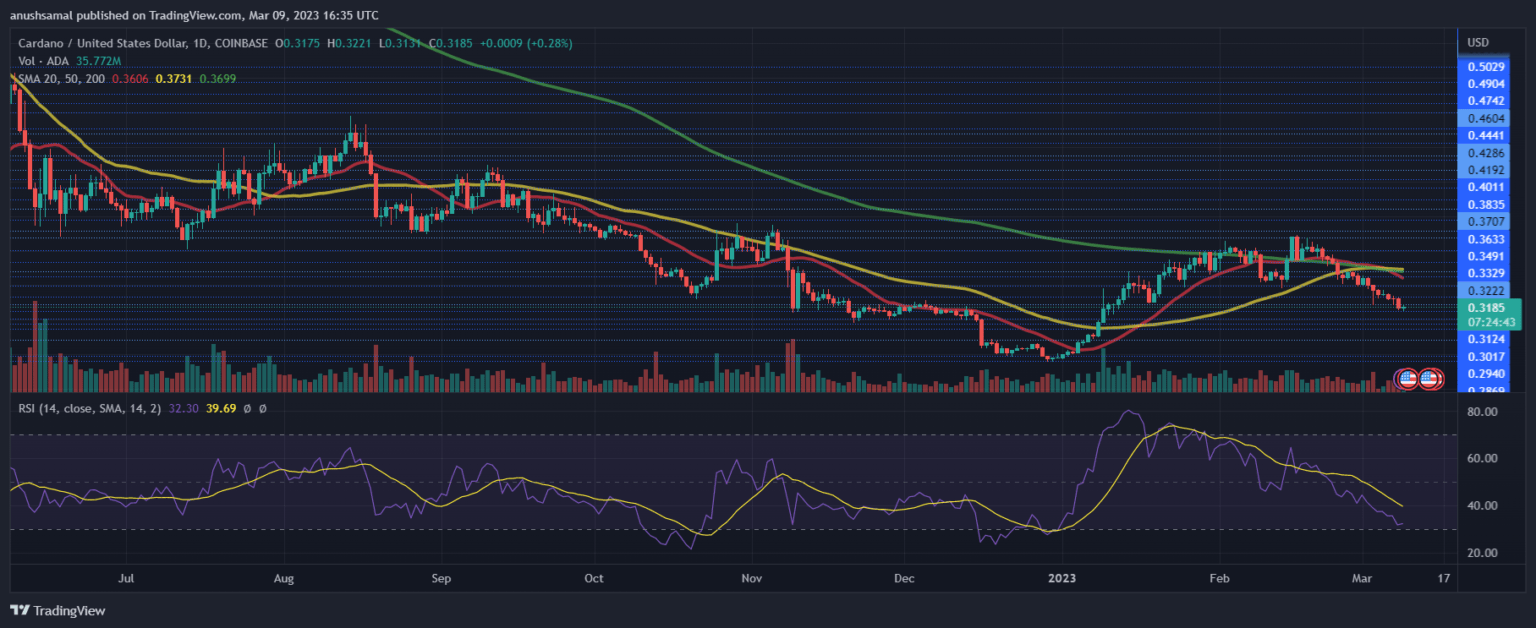
Buyers’ confidence has considerably fallen since the last week of February. The Relative Strength Index traveled below the half-line and above the 20-mark. This indicated oversold tendencies, as ADA was undervalued.
The price of the altcoin moved below the 20-Simple Moving Average line as it implied that sellers were driving the price momentum in the market. For ADA to move north, demand for it has to shoot up.

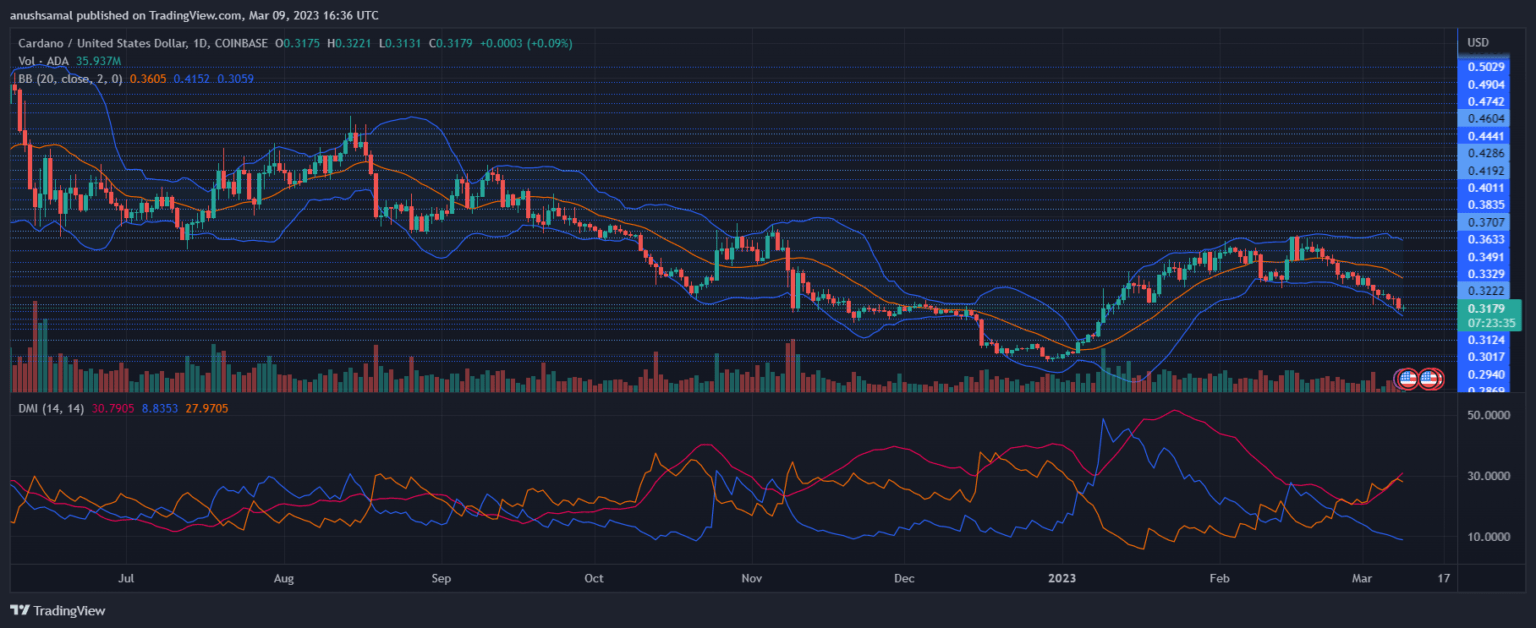
The Directional Movement Index (DMI) displays the asset’s price direction and the price trend’s strength. DMI was negative as the -DI line (orange) was above the +DI line (blue).
Related Reading: XRP Price Prediction: Market Sentiment Improves, Bulls Aim $0.42 or Higher
The Average Directional Index (red) shot past the 30-mark, which signified that the present price trend was gaining strength. This translates to a further fall in value before signs of price recovery. The Bollinger Bands measure price volatility and fluctuation. The bands grew apart, implying additional price volatility.
Featured Image From UnSplash, Charts From TradingView.com


 Bitcoin
  Ethereum
  Tether
  USDC
USDC  TRON
TRON  Dogecoin
  Cardano
  Bitcoin Cash
  Chainlink
  LEO Token
  Zcash
Zcash  Monero
  Stellar
  Litecoin
  Hedera
  Cronos
  Dai
Dai  OKB
OKB  Tether Gold
  Ethereum Classic
  KuCoin
  Algorand
  Gate
Gate  Cosmos Hub
  VeChain
  Stacks
  Tezos
Tezos  Dash
Dash  TrueUSD
  IOTA
IOTA  Basic Attention
  Theta Network
  Decred
  NEO
NEO  Synthetix
  Qtum
Qtum  0x Protocol
  Ravencoin
  DigiByte
  Zilliqa
  Nano
Nano  Siacoin
  Numeraire
  Waves
Waves  Ontology
  Enjin Coin
  Status
  BUSD
BUSD  Hive
Hive  Lisk
Lisk  Pax Dollar
  Steem
Steem  Huobi
Huobi  OMG Network
  NEM
NEM  Bitcoin Gold
  Augur
Augur  Ren
Ren