Cardano Price Analysis: Is $ADA Price Ready to Reclaim $0.4 Mark?

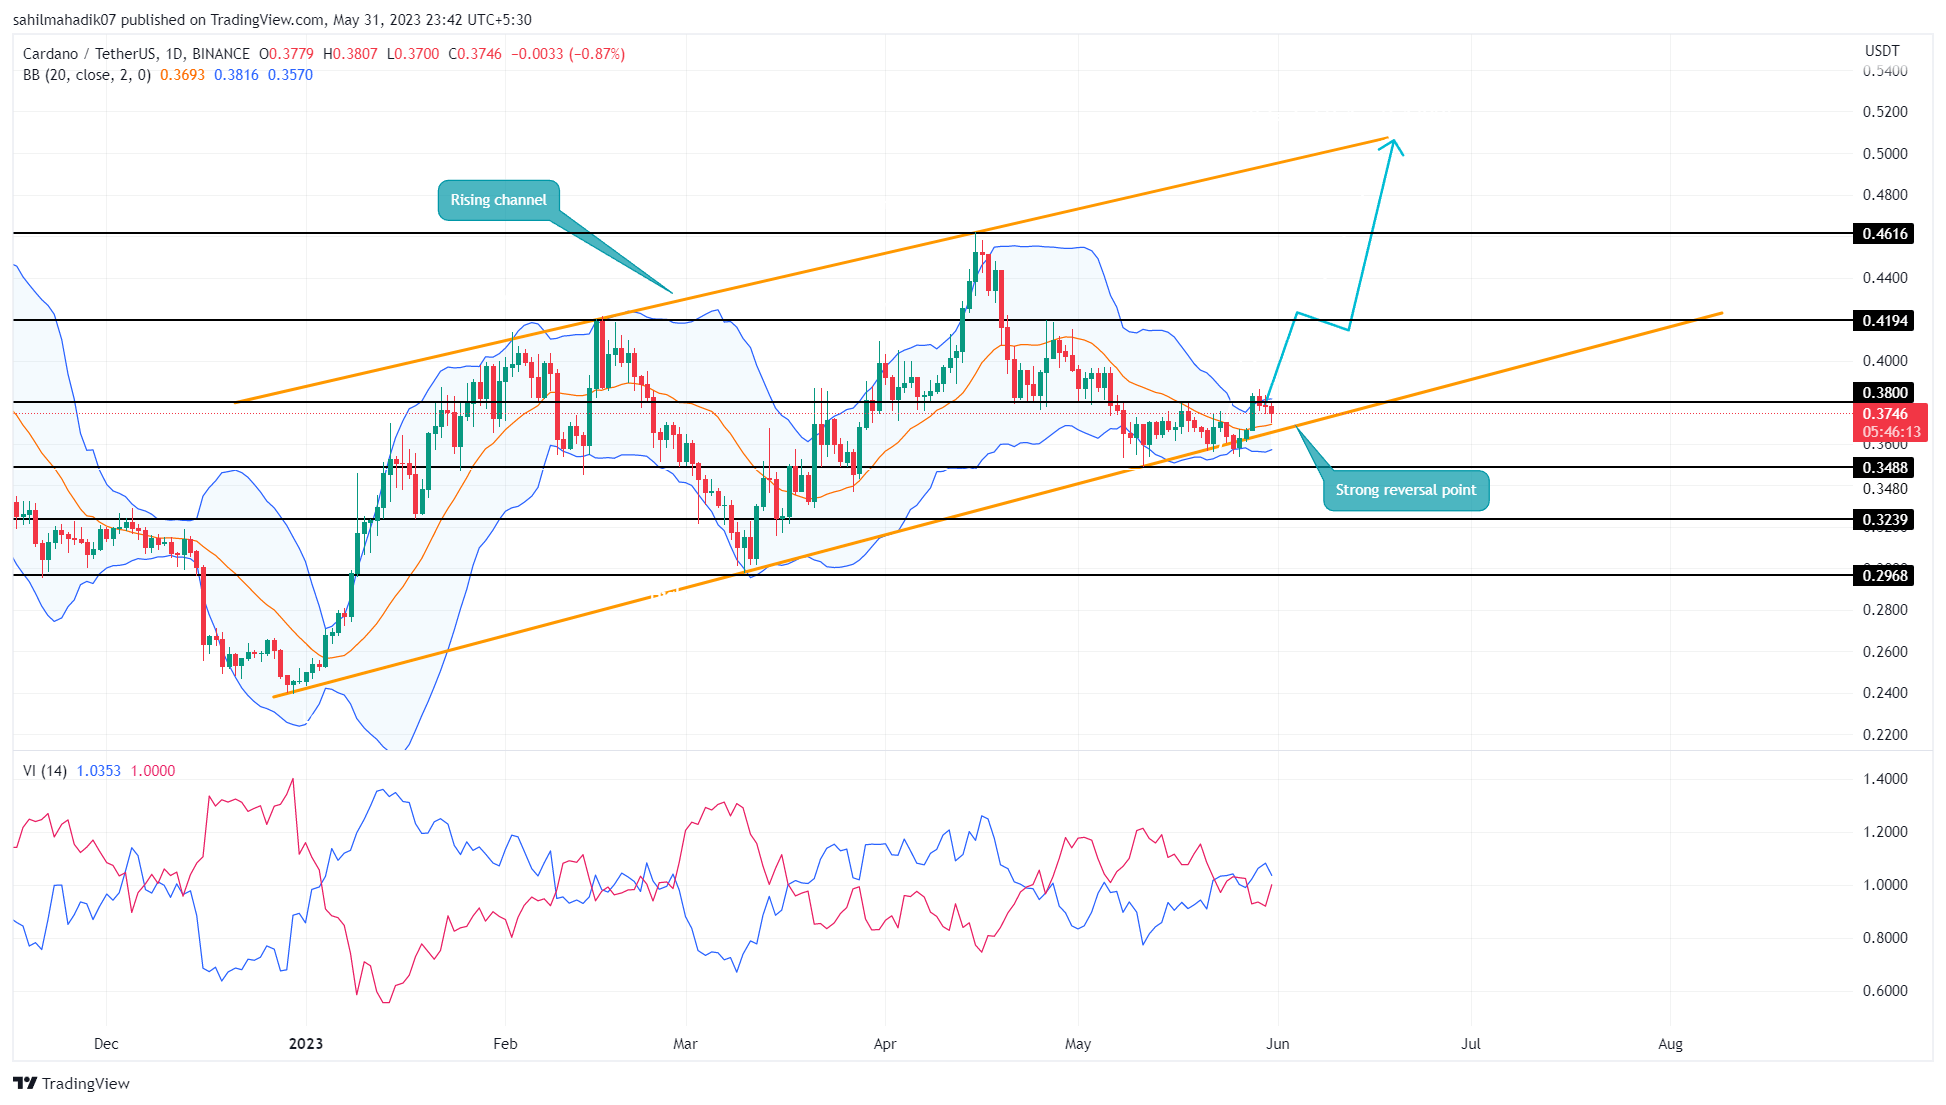
Cardano Price Analysis: Today, the crypto market experienced increased selling pressure, leading to a downward trend in several major cryptocurrencies. As a result, the Cardano price is down 1.22% and is approaching the support trendline of the rising channel pattern. Historically, this ascending trendline has acted as an active accumulation zone for traders which usually results in a massive recovery cycle.
Also Read: Cardano Price Prediction 2023, 2025, 2030: ADA signals for upcoming surge
Cardano Price Daily Chart
- The Cardano coin price maintains an overall bullish trend until the channel pattern is intact
- A breakdown below the lower trendline will signal the resumption of the prior downtrend
- The intraday trading volume in the ADA coin is $189.5 Million, indicating an 0.97% gain

Source- Tradingview
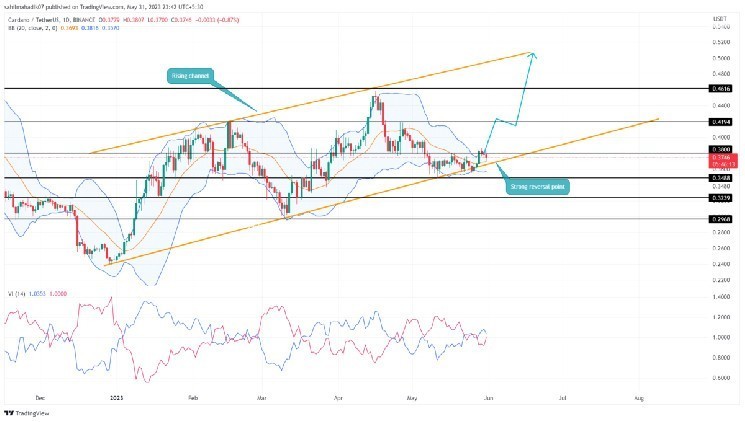
On May 28th, the ADA price gave a bullish breakout from a local resistance of $0.38 in anticipation of kickstarting a new recovery rally. However, with the increasing selling pressure in the market, the buyers failed to sustain this level and plunged below $0.38 again.
This breakdown plummeted Cardano coin price to $0.37 and is likely to tumble another 2% to hit the ascending trendline. Over the last five months, altcoin has rebounded from this support thrice indicating a strong buying zone.
Thus, the ADA price is likely to bounce off this level and recuperate the bullish momentum. If a potential reversal occurs, the buyers may drive the prices to reach $0.42, followed by $0.46, and $0.5.
Will Cardano Price Tag $0.4 Mark?
A potential bullish reversal from the support trendline will recuperate the bullish momentum in ADA price. In theory, a reversal from a lower trendline bolsters buyers to carry a recovery cycle back to the upper trendline. Thus, the resulting recovery may push the Cardano price to the first target of $0.42.
- Bollinger band: The bands of the BB indicator squeezed significantly indicate the ADA price is currently in a highly volatile phase.
- Vortex Indicator: The VI+(blue) and VI-(orange) slope in a bullish crossover state reflect the market trend is bullish.


 Bitcoin
  Ethereum
  Tether
  USDC
USDC  TRON
TRON  Dogecoin
  Cardano
  Bitcoin Cash
  Chainlink
  LEO Token
  Monero
  Zcash
Zcash  Stellar
  Litecoin
  Hedera
  Dai
Dai  Cronos
  OKB
OKB  Tether Gold
  Ethereum Classic
  KuCoin
  Algorand
  Gate
Gate  Cosmos Hub
  VeChain
  Stacks
  Tezos
Tezos  Dash
Dash  TrueUSD
  IOTA
IOTA  Basic Attention
  Theta Network
  Decred
  NEO
NEO  Synthetix
  Qtum
Qtum  0x Protocol
  Ravencoin
  DigiByte
  Zilliqa
  Holo
Holo  Nano
Nano  Siacoin
  Numeraire
  Waves
Waves  Status
  Enjin Coin
  Ontology
  Hive
Hive  BUSD
BUSD  Lisk
Lisk  Pax Dollar
  Steem
Steem  Huobi
Huobi  NEM
NEM  OMG Network
  Bitcoin Gold
  Augur
Augur