CELO Technical Analysis: Can Buyers Support The $1 Threshold?

The CELO price action shows a range breakout rally attempting to break the resistance trendline and reach the $1.23 mark.
Key Technical Points:
- The CELO prices jumped by 40% last night, resulting in a vast bullish candle in the daily candle.
- The bull run exceeds the 100-day SMA and challenges the $2.67 mark.
- With a market cap of $482 million, the intraday trading volume of CELO has increased by 3% to reach $20 million.
Past Performance of CELO
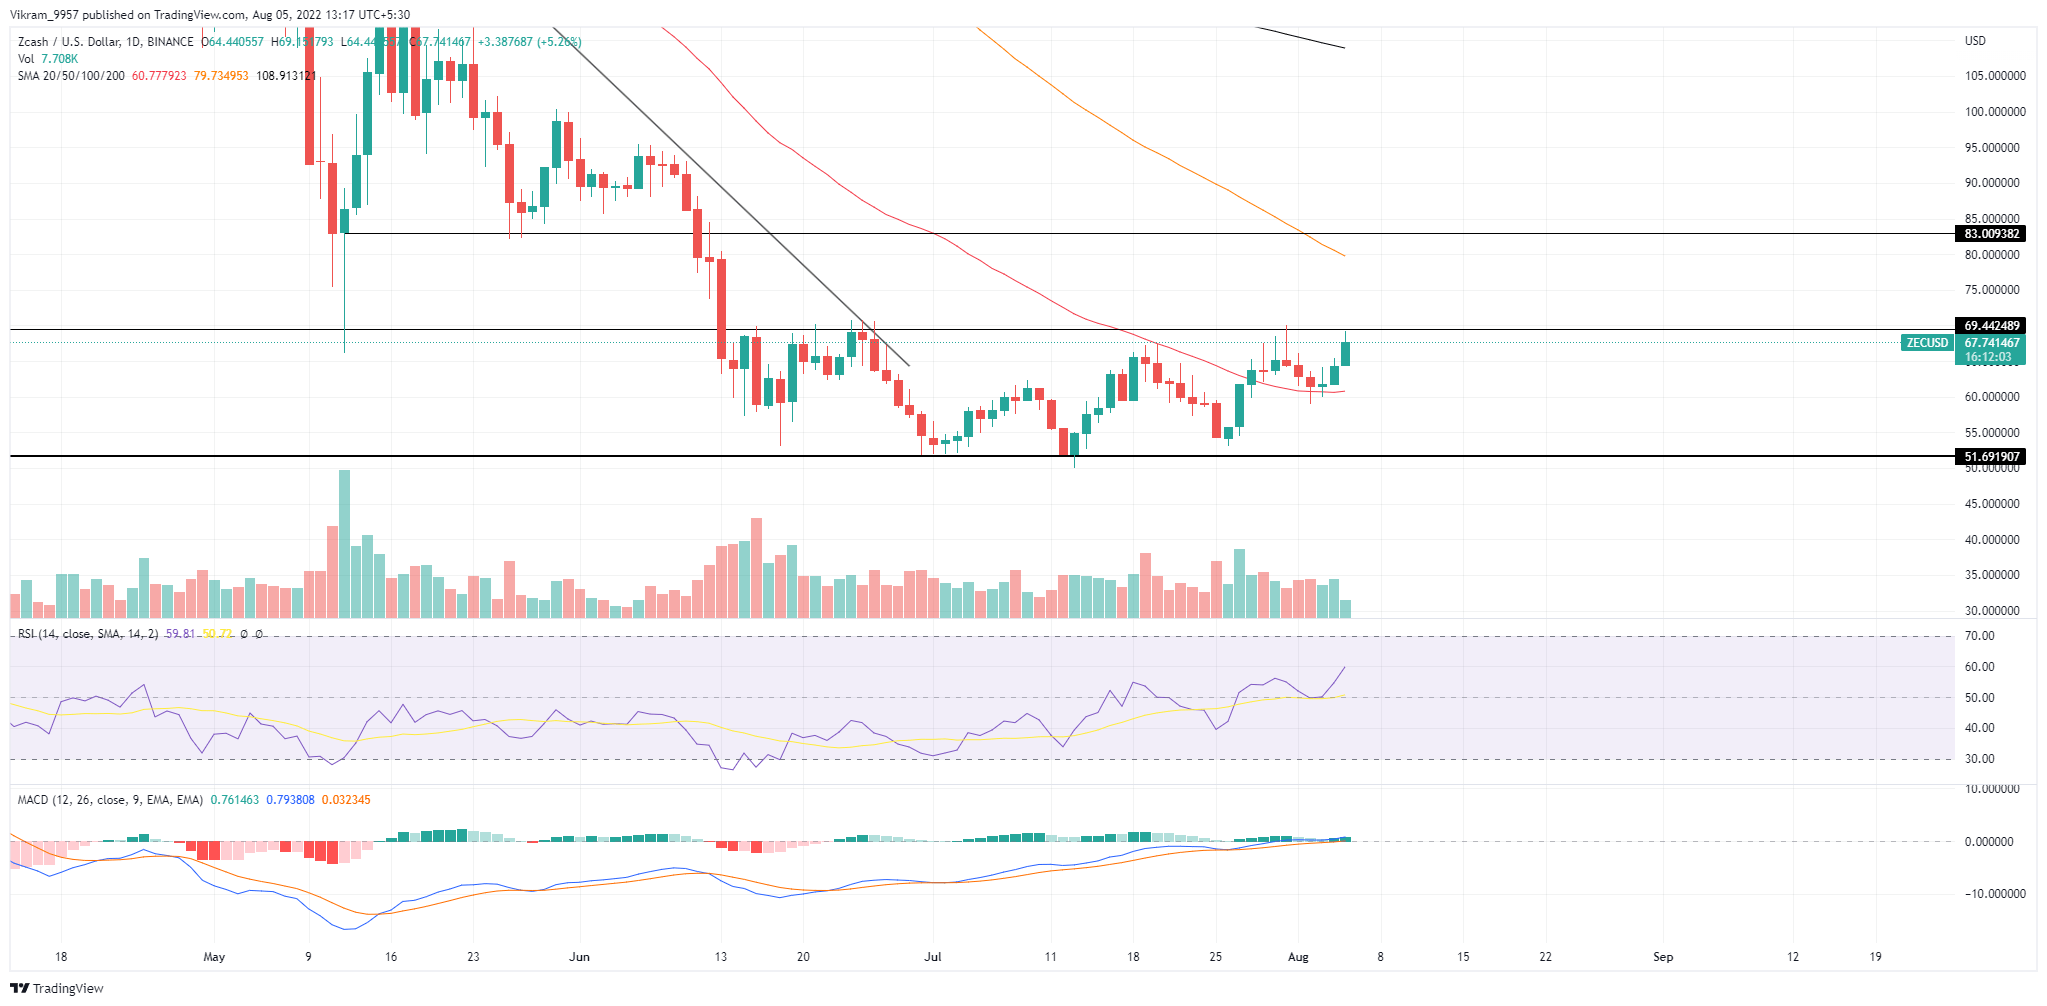
The CELO price action shows a bullish trend in the daily chart, which is evident by the ascending resistance trendline. The recent bullish trend starting from the $0.80 mark breaks the resistance of the consolidation range at the $1 mark. After that, however, the breakout rally takes a turnaround from the resistance trendline to retest the $1 breakout.

Source — Tradingview
CELO Technical Analysis
The CELO price action shows a successful post-retest reversal from the $1 mark with a morning star pattern. However, the bullish reversal fails to see any significant spike in trading volume, projecting a less likelihood of the trendline breakout. The RSI slope shows a bullish reversal from the 14-day average line to sustain in the nearly overbought zone. Hence, the technical indicator reflects a solid underlying bullishness projecting the likelihood of an uptrend continuation above the psychological mark of $1. The MACD indicator shows a decline in bullish spread between the fast and slow lines as the MACD histograms crash to the Zero line. Hence, the increasing likelihood of a bearish crossover in the MACD indicator warns of a bullish failure. Therefore, the technical indicators have an opposite viewpoint, suggesting the traders should wait for price action confirmation. In a nutshell, the CELO technical analysis showcases an increasing pressure above $1, which the buyers need to undermine to reach $1.23.
Upcoming Trend
If the CELO price breaks above the resistance trendline, an uptrend continuation might exceed the $1.23 mark. In such a case, traders can expect the uptrend to hit the $1.50 mark. However, if the buyers fail to keep the market value floating above the $1 mark, a breakdown rally will hit the $0.80 mark. Resistance Levels: $1.23 and $1.5 Support Levels: $1 and $0.80


 Bitcoin
  Ethereum
  Tether
  USDC
USDC  TRON
TRON  Dogecoin
  Cardano
  Monero
  Bitcoin Cash
  Chainlink
  LEO Token
  Stellar
  Zcash
Zcash  Litecoin
  Hedera
  Dai
Dai  Cronos
  OKB
OKB  Tether Gold
  Ethereum Classic
  KuCoin
  Cosmos Hub
  Algorand
  Gate
Gate  VeChain
  Dash
Dash  Stacks
  Tezos
Tezos  TrueUSD
  IOTA
IOTA  Decred
  Theta Network
  Basic Attention
  NEO
NEO  Synthetix
  Qtum
Qtum  Ravencoin
  0x Protocol
  Zilliqa
  DigiByte
  Nano
Nano  Siacoin
  Numeraire
  Waves
Waves  Ontology
  Enjin Coin
  Status
  Hive
Hive  BUSD
BUSD  Lisk
Lisk  Pax Dollar
  Steem
Steem  Huobi
Huobi  OMG Network
  Bitcoin Gold
  NEM
NEM  Augur
Augur